Projects & Publications
Note: EPA no longer updates this information, but it may be useful as a reference or resource.
Lower Rio Grande Valley Transboundary Air Pollution Project (TAPP)
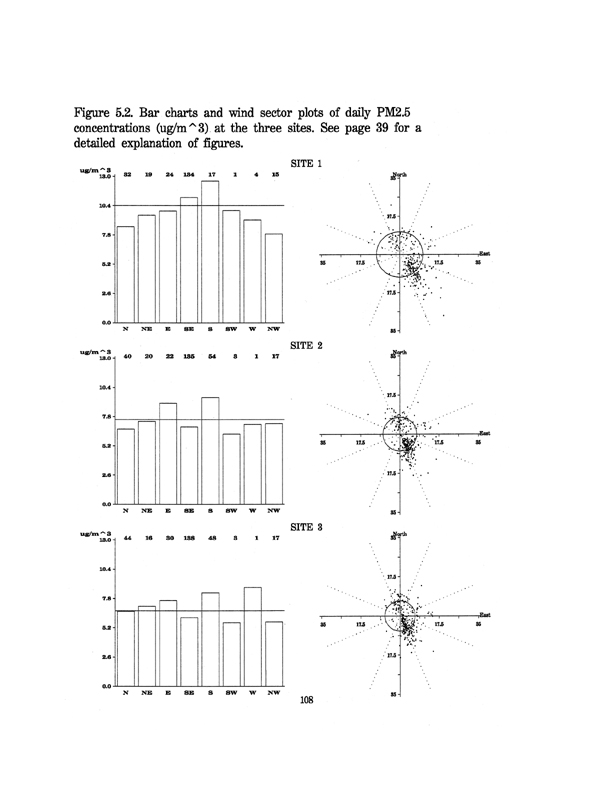
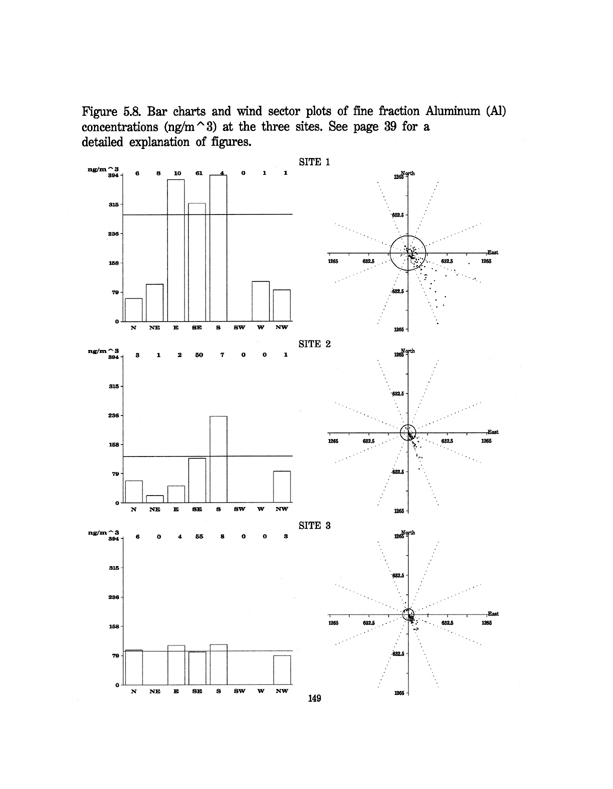
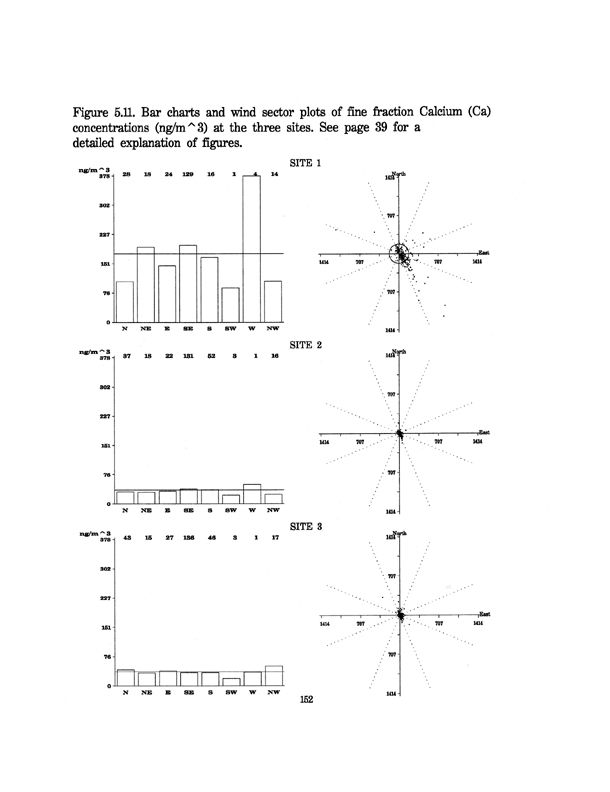
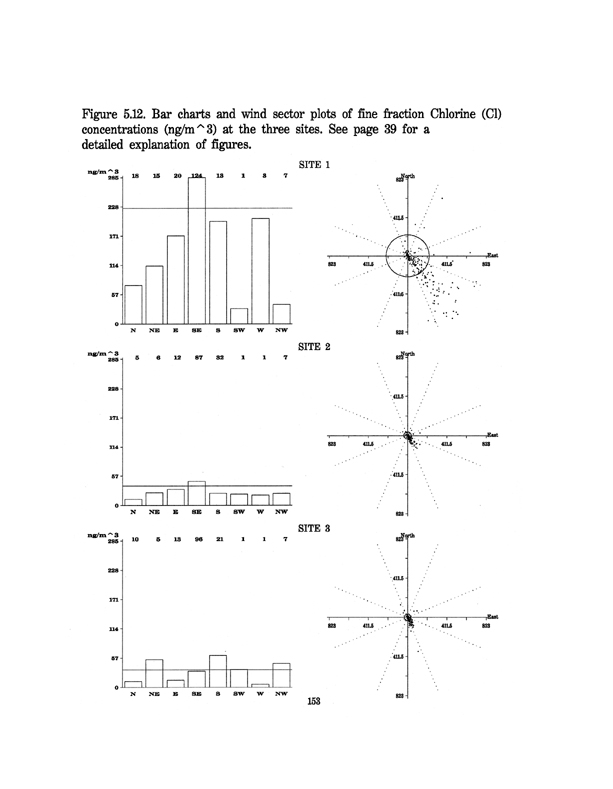
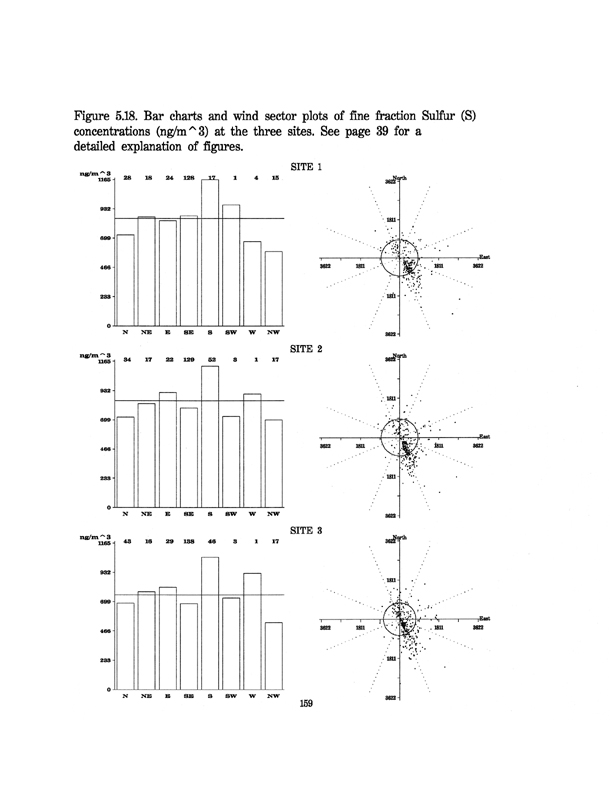
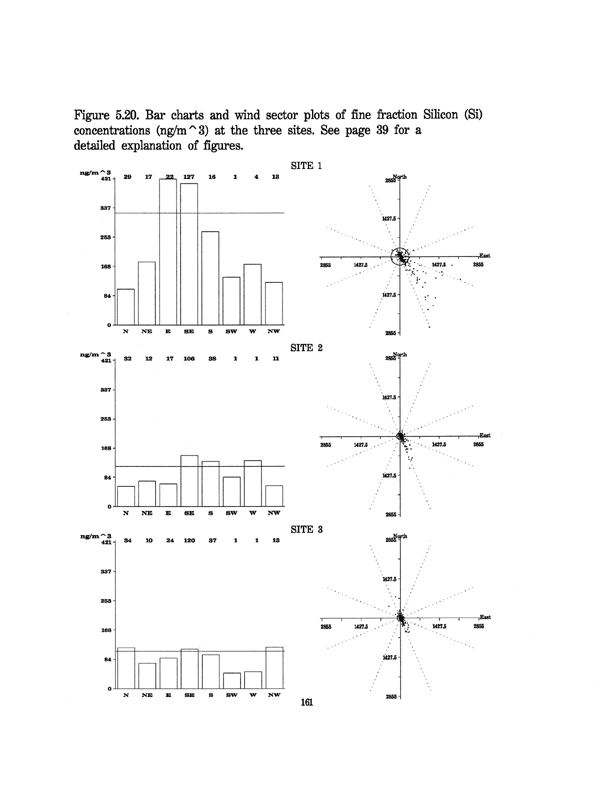
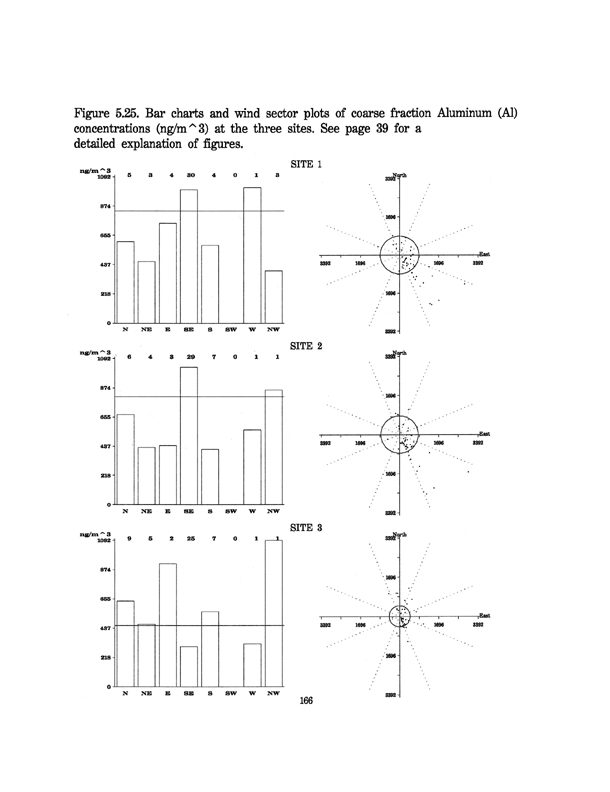
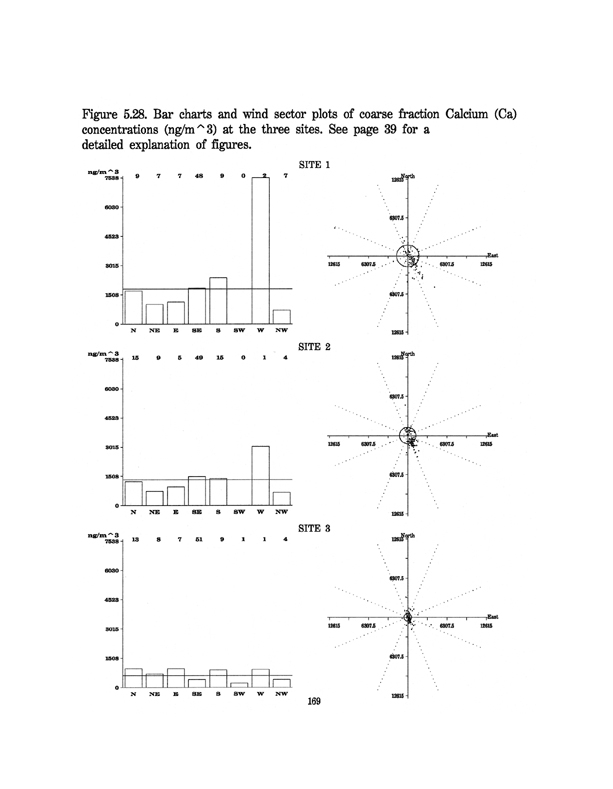
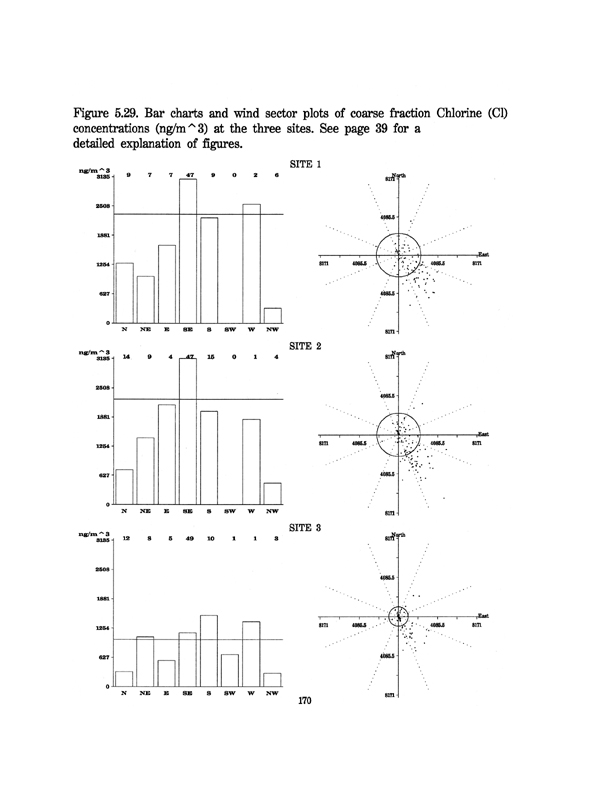
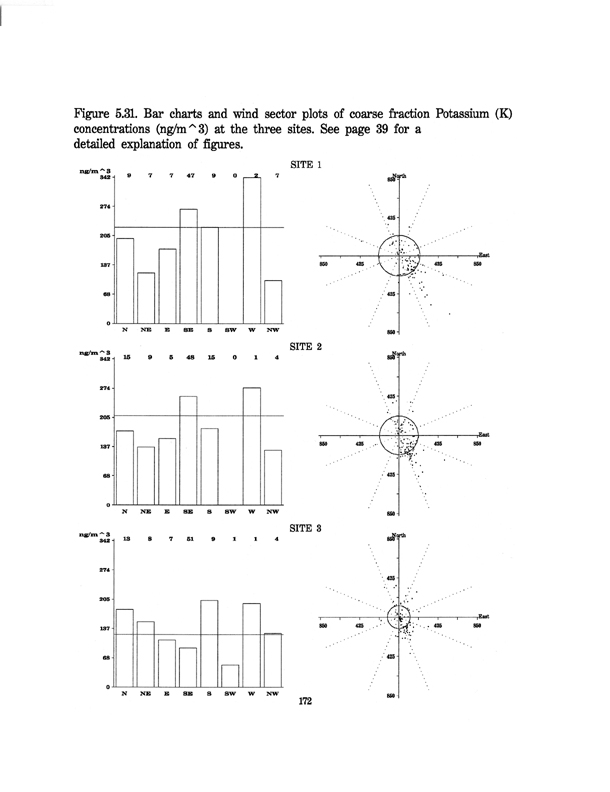
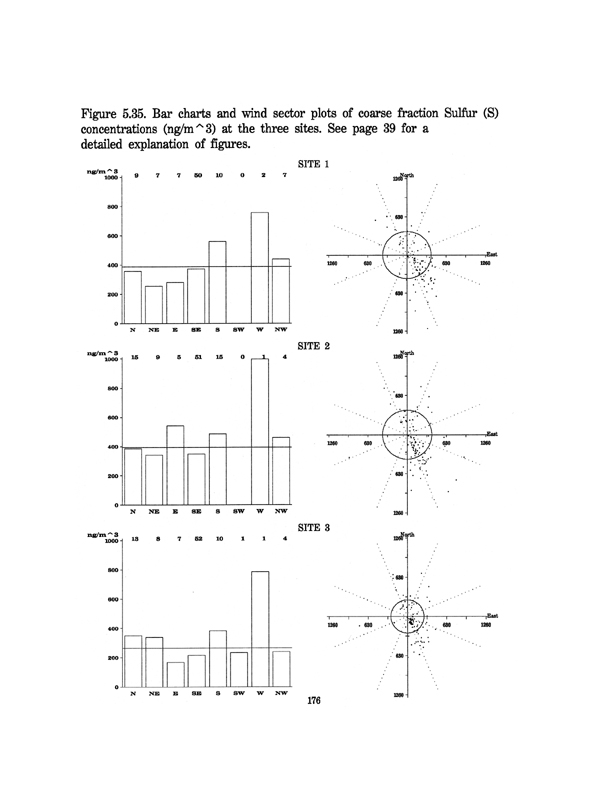
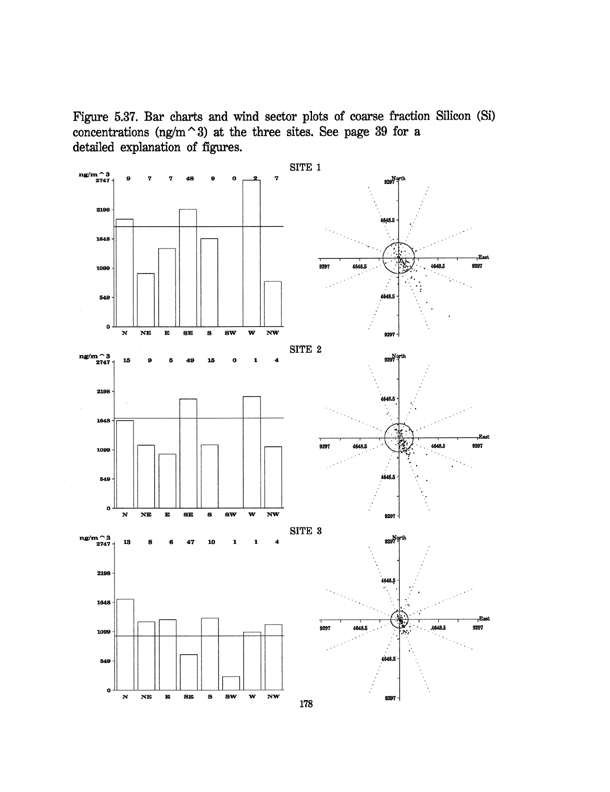
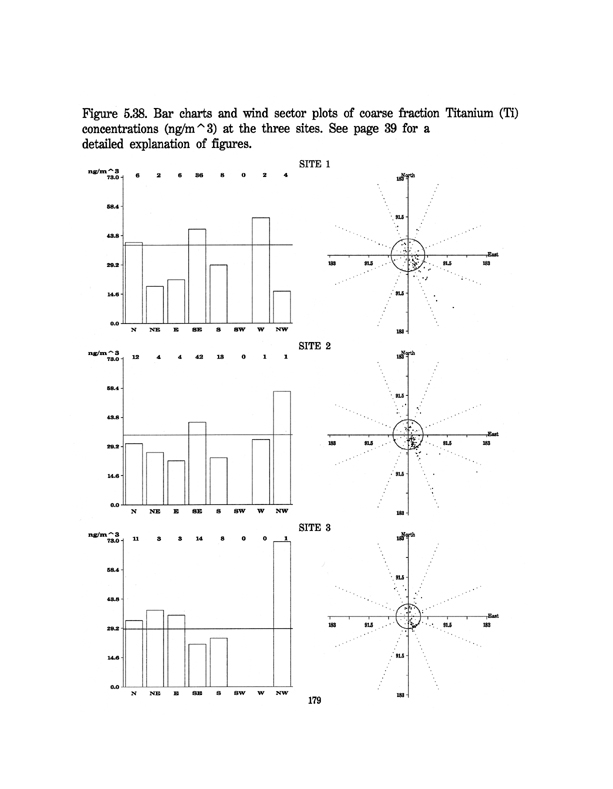
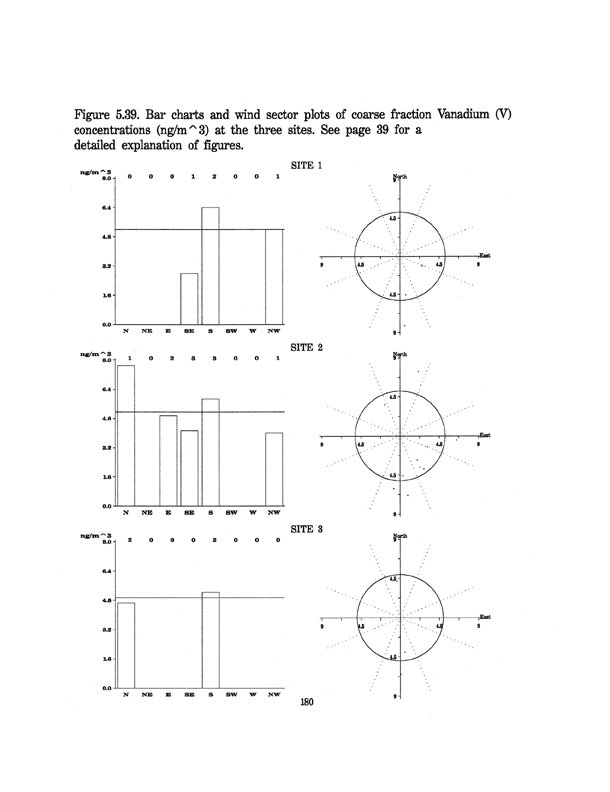
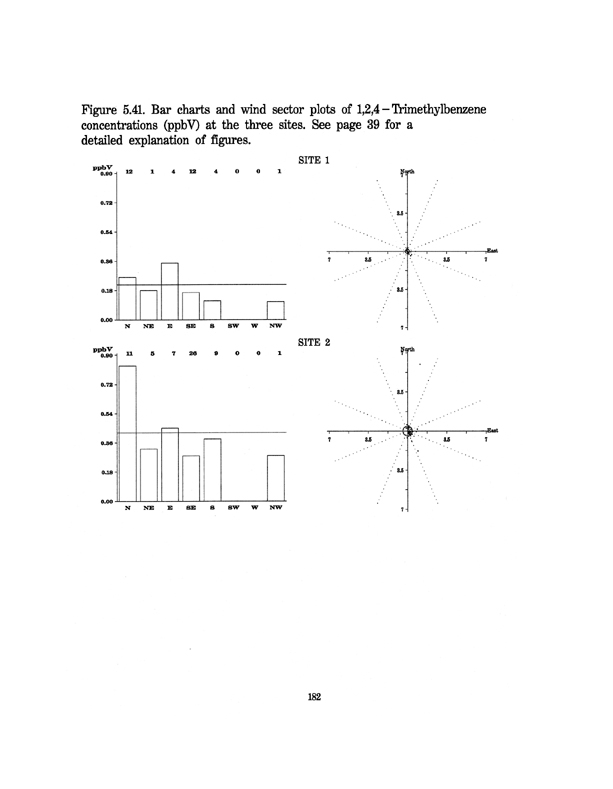
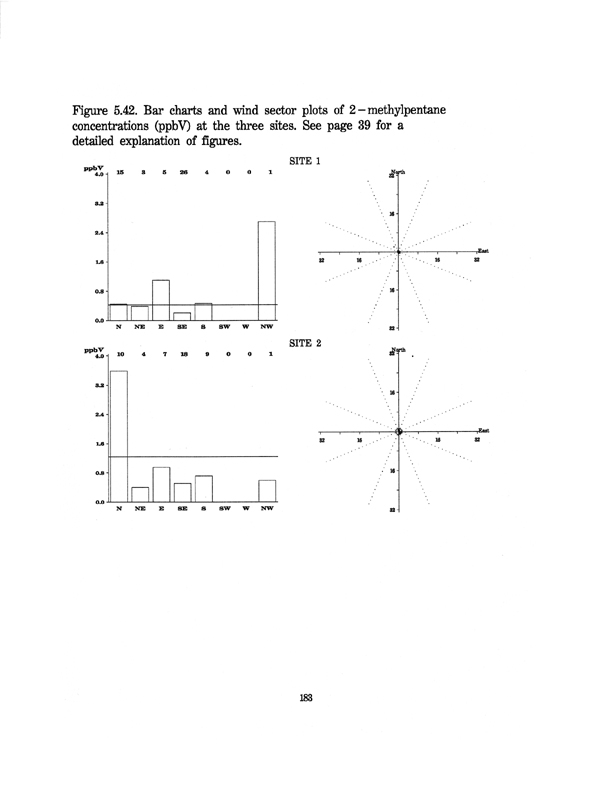
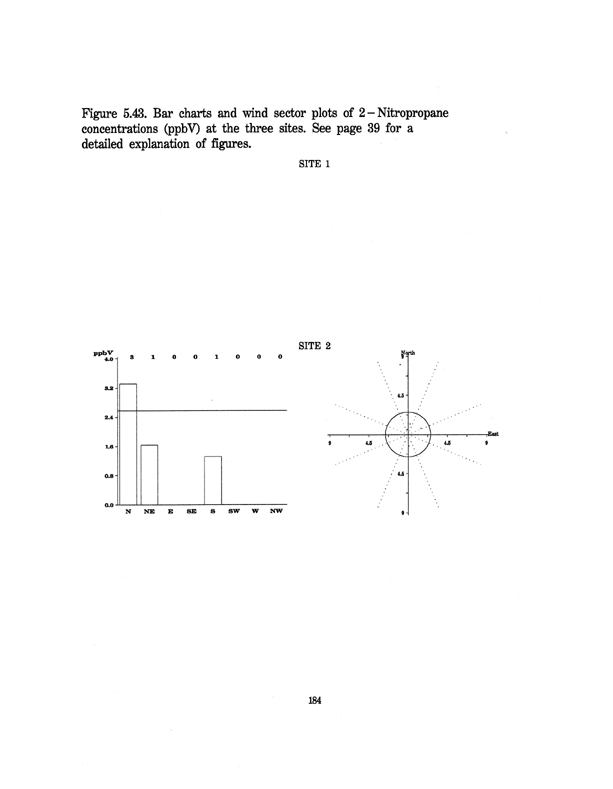
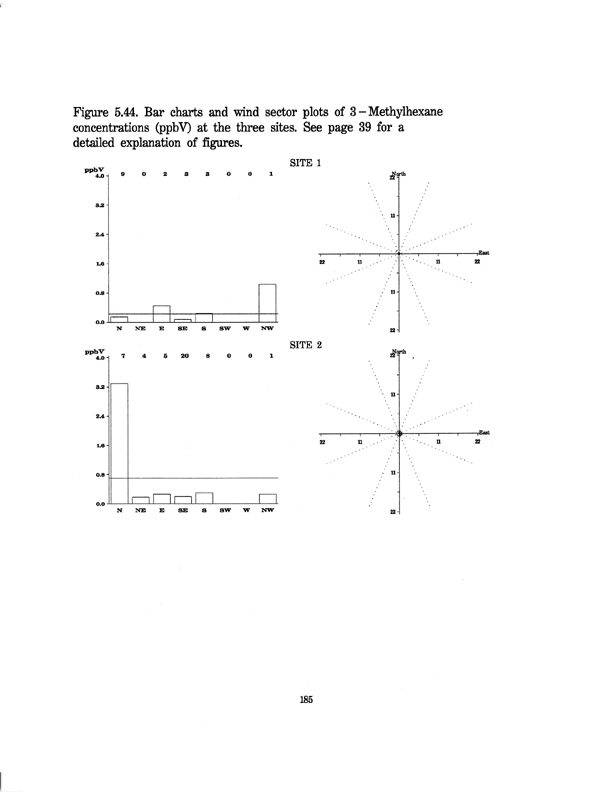
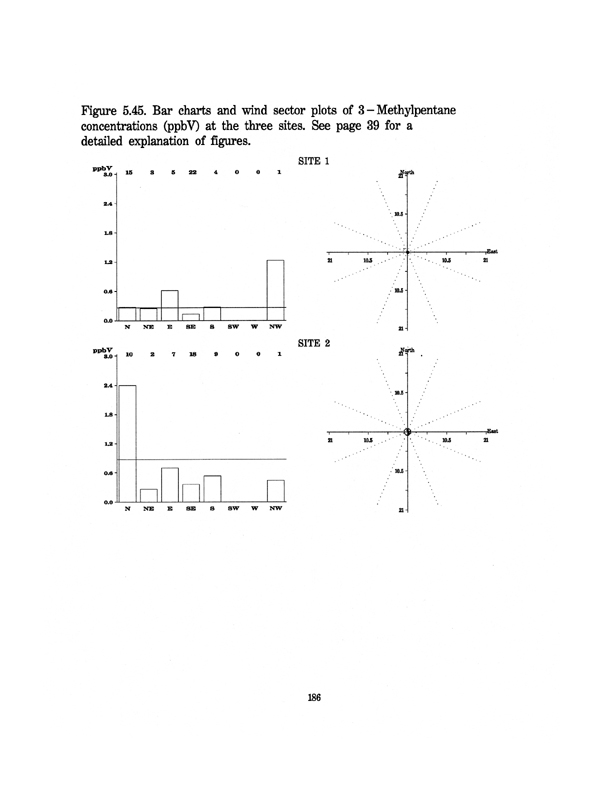
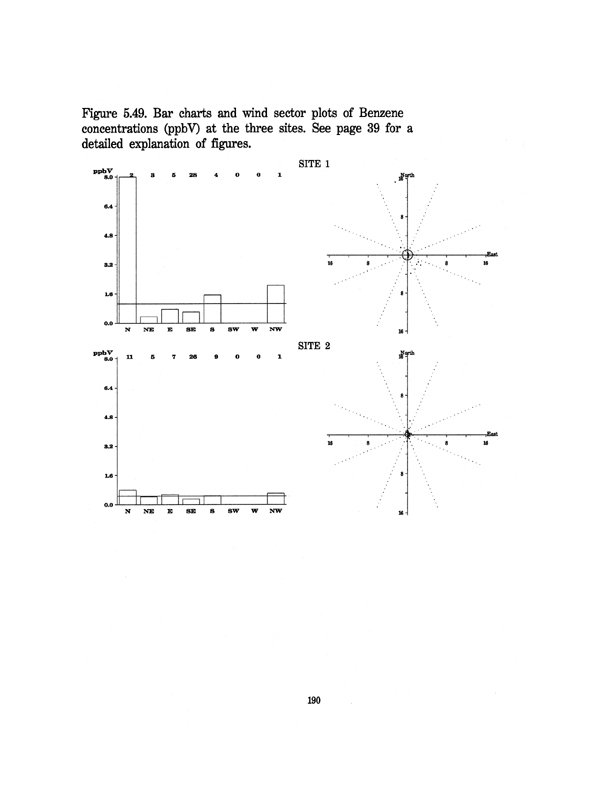
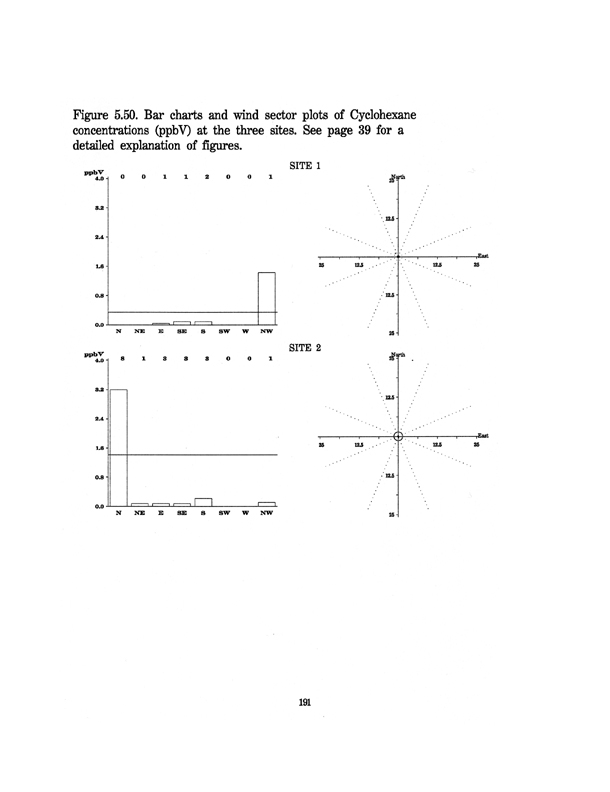
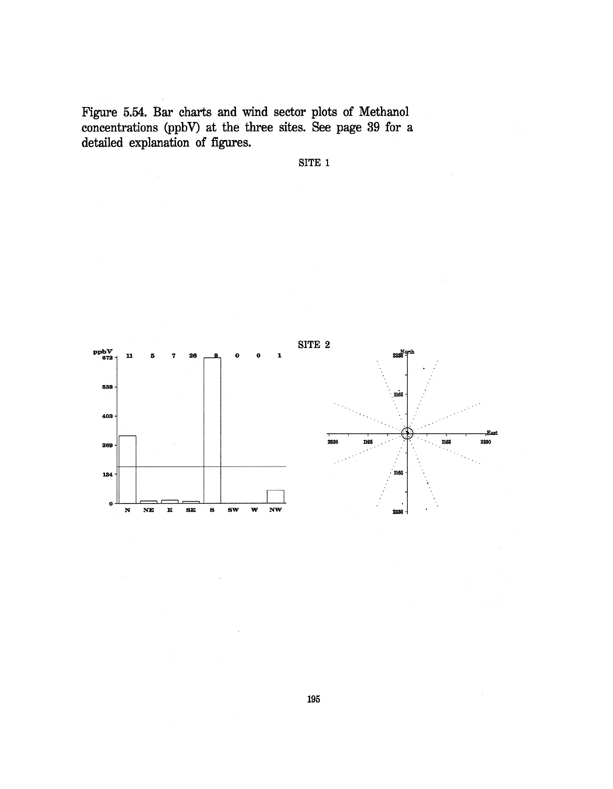
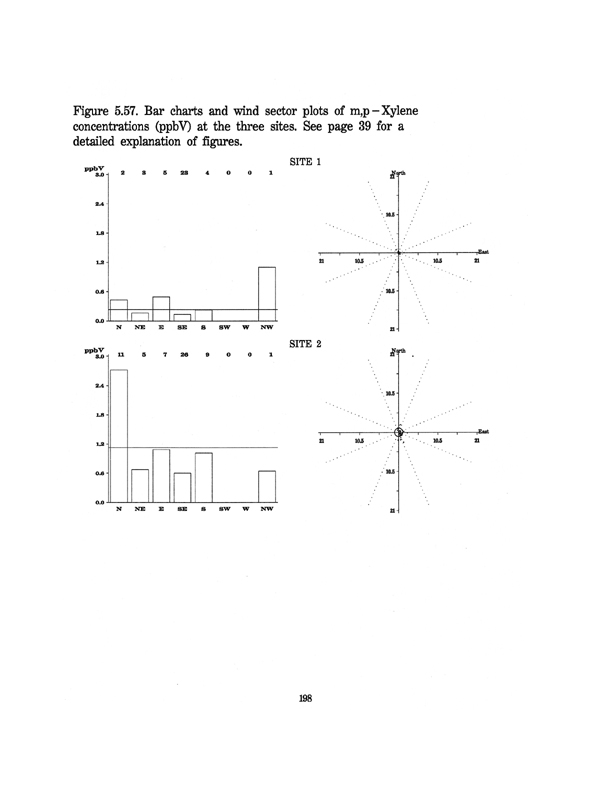
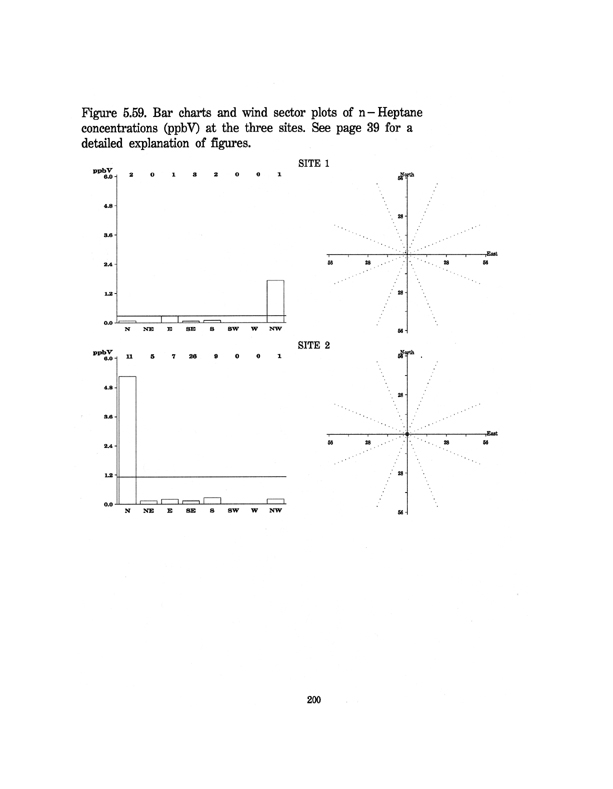
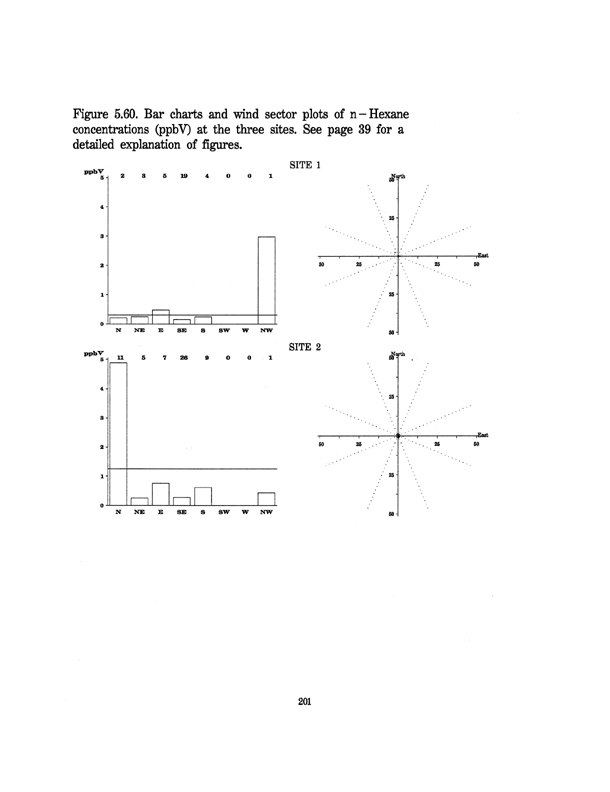
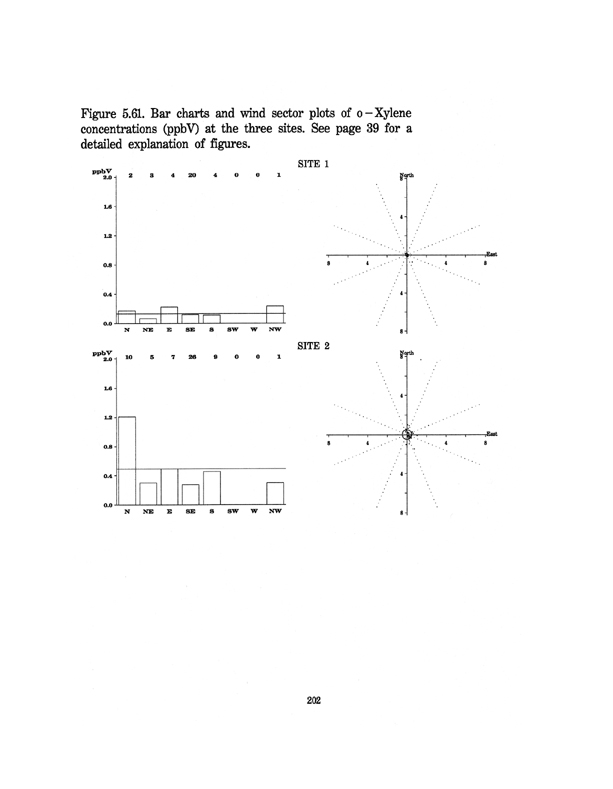
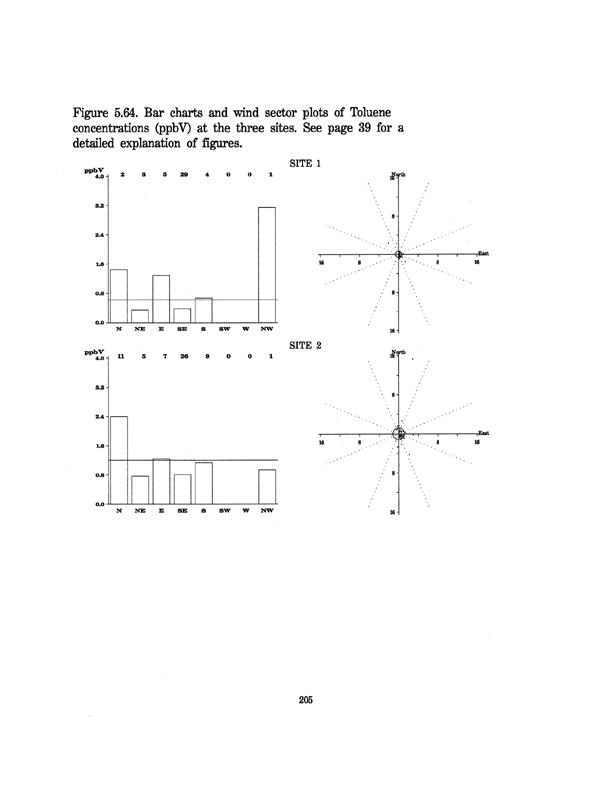
To provide an indication of the direction from which air pollutant concentrations were coming, meteorological data along with air pollution data collected at each site were used in the development of both bar charts and wind sector plots for selected air pollutants. These are shown in the TAPP Figures below for the study's Project Report (EPA/600/R-99/047). The bar chart and wind sector plot for a given pollutant collected at a site are shown side-by-side. All three sites' data are shown together on one page for ease of inspection and interpretation. Data in bar charts and wind sector plots are presented from eight wind sectors: North (N, 337.6° to 22.5° ), Northeast (NE, 22.6 to 67.5 ), East (E, 67.6° to 112.5° ), Southeast (SE, 112.6° to 157.5° ), South (S, 157.6° to 202.5° ), Southwest (SW, 202.6° to 247.5° ), West (W, 247.6° to 292.5° ), and Northwest (NW, 292.6° to 337.5° ). In the bar chart figures, the air pollutant concentration data are averaged according to the sector from which the air pollutant is measured as coming. The number of observations used in developing the average is shown on the top of the respective bar. The overall average is shown as a horizontal line.
For wind sector plots, air pollution data are displayed in a format similar to wind rose plots with the direction from where the pollutant was coming from being plotted based on a 360° circle with 0° (or 360° ) indicating North, 90° indicating East, 180° indicating South, and 270° indicating West. The magnitude of each pollutant concentration is proportional to its distance from the origin of the plot. The overall average values of the plotted data, shown as lines in the bar charts, are represented by circles. The dotted lines are the boundaries for the eight wind sectors divided in the same way as explained for the bar charts. For volatile organic compounds (VOCs), measurements were only performed at 2 sites (Sites 1 and 2); therefore, no bar charts or wind sector plots are shown for Site 3.
Selected TAPP Figures: EPA/600/R-99/047 | ||||||||||||||||||||||||||||||||||||||||||||||||||||||||||||||||||||||||||||||||||||||||||||||||||||||||||||||||||||||||||||||||||||||||||||||||||||||||||||||||||||||||||||||||||||||||||||||||||||||||||||||||||||||||||||||||||||||||||||||||||||||||||||||||||||||
|
| |||||||||||||||||||||||||||||||||||||||||||||||||||||||||||||||||||||||||||||||||||||||||||||||||||||||||||||||||||||||||||||||||||||||||||||||||||||||||||||||||||||||||||||||||||||||||||||||||||||||||||||||||||||||||||||||||||||||||||||||||||||||||||||||||||||