Hurricane Sandy Response
Hurricane Sandy Response Efforts
Response timeline | January 11, 2013:
General
The U.S. Army Corps of Engineers, at the request of New York City, is using two air curtain incinerators at Floyd Bennett Field in Brooklyn, NY to burn vegetative debris, largely from downed trees, gathered in the cleanup from Hurricane Sandy. An air curtain incinerator is a self-contained system that reduces wood debris to ash. It is equipped with air blowers that circulate the air to improve combustion and minimize emissions of fine particles.
The U.S. Environmental Protection Agency has eight fine particle monitors operating around the perimeter of Floyd Bennett Field to monitor for potential impacts of the air curtain devices. An EPA On-Scene Coordinator is on-site while the burning takes place to monitor what is being burned and air quality at the field.
Levels of fine particles are measured by the monitors and averaged over a 24-hour period. Results from the monitors are compared to an established 24-hour health-based standard. That standard is 35 micrograms per cubic meter of air (�g/m3). If the 24-hour standard is exceeded, the EPA will notify the Army Corps and New York City. Monitoring began on December 28.
Air Monitoring for Air Curtain Incinerator
The EPA has been monitoring fine particle levels since December 28 when the Corps of Engineers began running the air curtain burner. Since December 28, results from operating monitors showed that the 24 hour standard has not been violated, except for January 9. On that day, overall weather conditions in NYC and most of the northeast and New York City resulted in an inversion in the air, which reduced the atmosphere's ability to mix and dilute pollution. For a more detailed discussion, please see: https://epa.gov/region02/sandy/response_1-10-13.html.
The EPA has an established Air Quality Index reports daily air quality across the country. The index indicates how clean or polluted the air in a particular area is and what associated health effects might be a concern. For more information about the Air Quality Index, visit http://airnow.gov/.
Results of EPA's air monitoring and the locations of the monitors can be found at:
https://www.epa.gov/sandy/data/fbf-results.pdf and
https://www.epa.gov/sandy/pdf/fbf-map.pdf
The image below shows the location of the eight monitors, on Floyd Bennet Field, New York City, surrounding the air curtain burn device. Click on air monitor to see data associated with it.
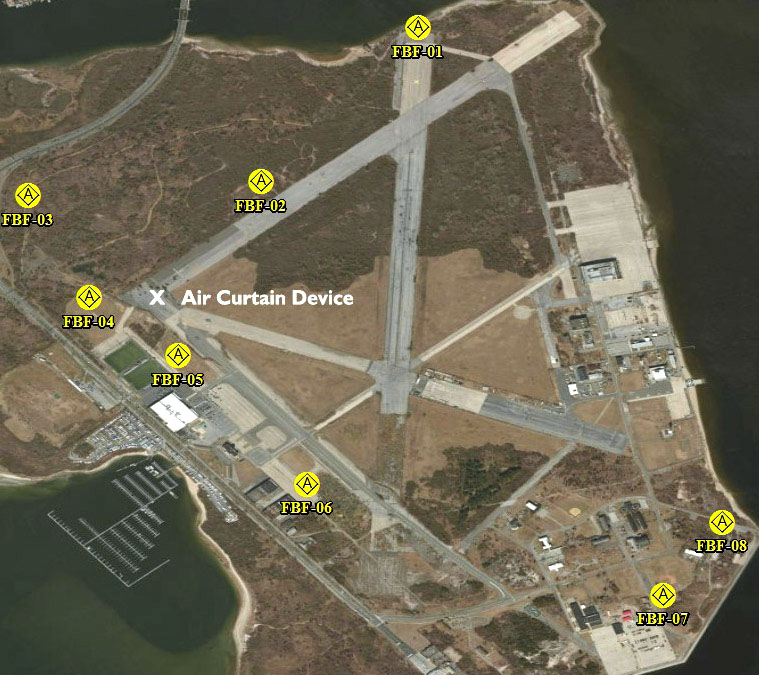
FBF-01 | FBF-02 | FBF-03 | FBF-04 | FBF-05 | FBF-06 | FBF-07 | FBF-08
Historical Information About the Response
Response Timeline
Nov 2012 8 9 10 11 12 13 14 15 16 17 18 19 20 21 23 24 25 26 27 28 29 30
Dec 2012 1 2 4 6 8 10 12 14 17 18 27
Jan 2013 2 3 4 7 8 9 10 11 14 15 16 17 18 22 23 24 25 29 30 31
Feb 2013 1 4 5 6 7 8 12 13 14 20 21
March 2013 1 7
April 2013 11
**Data not available from this monitor.