EPA Response to BP Spill in the Gulf of Mexico
Air Data from the Gulf Coastline
In response to the BP oil spill, EPA monitored air, water, sediment, and waste generated by the cleanup operations. Ongoing response and restoration efforts are posted to RestoreTheGulf.gov.
While emergency response data collection has ended, results continue to be available on this site. Any new data will continue to be posted to this site, and data will continue to be available here for the foreseeable future.
Much of the content of this site continues to be available for historical and information purposes, but we are no longer updating these pages on a regular basis.
Learn about odors from the BP Oil Spill
To report an odor please call - 1-866-448-5816
- Real-time air monitoring for ozone and PM2.5 and hydrogen sulfide
- Air monitoring and sampling data for PM10, H2S, VOCs, and PAHs
- Download Air Monitoring and Sampling Data
- Trace Atmospheric Gas Analyzers (TAGA bus)
- ASPECT plane data
- Daily Average Particulate Matter
You will need Adobe Reader to view some of the files on this page. See EPA's PDF page to learn more.
Real-time air monitoring for ozone and fine particulate matter (PM2.5) and hydrogen sulfide (H2S)
Note: real-time data are no longer available, but we've kept the link text visible for historical purposes.
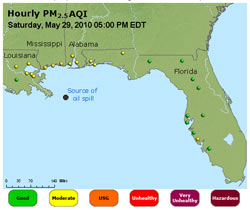
Air Now Current Air Quality along the Gulf Coast
This monitoring provides current ozone and fine particulate matter (PM2.5) data that are used to calculate Air Quality Index values.
Former link: View current air quality conditions and forecasts along the Gulf Coast
EPA set up a high resolution monitor to gather real-time measurements of hydrogen sulfide (H2S) in outdoor air near Venice, Louisiana. This high resolution H2S monitoring equipment has been located near existing monitor V03 located in Buras, Louisiana. Learn more about H2S | Learn more about the high resolution monitor
Former link: View current H2S conditions in Buras, Louisiana
Air monitoring and sampling data for coarse particulate matter (PM10), H2S, VOCs, and PAHs
Air monitoring data are collected from portable high-level screening monitors and from portable particle pollution monitors. These monitors measure:- Total volatile organic compounds (VOCs)
- Hydrogen sulfide (H2S) | Learn more about H2S
- Coarse particulate matter (PM10) | Learn more about PM10
- Volatile organic compounds (VOCs) | Learn more about VOCs
- Polycyclic aromatic hydrocarbons (PAHs) | Learn more about PAHs
This map also shows off-shore air samples taken during dispersant application. The samples were taken over a four-day period in May at locations ranging from about 30 to 60 miles offshore. Learn more about this offshore air sampling for dispersant-related compounds.
Map of Air Monitoring and Sampling Data: All Locations, All Dates
Mouse over a location on the map to view reports on the air data collected at that site.
Download Air Monitoring and Sampling Data
Air monitoring data includes VOCs, H2S, PM10, and PM2.5
Download sampling and monitoring data.
- Data reports are available on the air sampling and monitoring locations shown on the interactive map on this page.
For all hydrogen sulfide (H2S) data posted before May 17, the detection limit is 1 ppm. For all H2S data posted May 17 or after the detection limit is 0.1 ppm.
Air samples analyzed for VOCs and PAHs along the Gulf coast
Download sampling and monitoring data.
- Data reports are available on the air sampling and monitoring locations shown on the interactive map on this page.
Trace Atmospheric Gas Analyzers (TAGA bus)
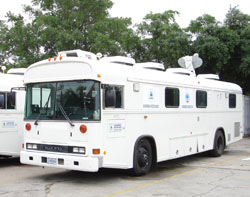
The TAGA bus analyzes the air along the Gulf Coast in response to the BP oil spill
EPA mobilized the Trace Atmospheric Gas Analyzers (TAGA), self-contained mobile laboratories to conduct real-time monitoring of outdoor air or emissions from various environmental sources.
- Learn more about TAGA mobile air monitoring
- View data and maps for VOC results
- View data and maps of monitoring for chemicals in dispersants
ASPECT data
EPA’s remote-sensing aircraft known as ASPECT (Airborne Spectral Photometric Environmental Collection Technology) collected air monitoring data in response to the oil spill.
- Learn more about the ASPECT aircraft
- View ASPECT imagery and air monitoring data (opens in Google Earth
 )
)
Daily Average Particulate Matter
To date, PM10 levels have been primarily in the 'good' to 'moderate' range which is not uncommon along the Gulf Coast in the summertime. Because oil burning has stopped we are no longer posting the PM10 air quality table. PM2.5 monitoring, which is a more protective indicator of particulate matter, can be seen at AirNow Current Air Quality along the Gulf Coast.
Government Response
- RestoreTheGulf.gov: official federal government site for spill response and recovery
Other federal government information:
Connect with us:
Facebook: EPA
Twitter: EPA
Photos: BP Spill | more photos
Get email updates
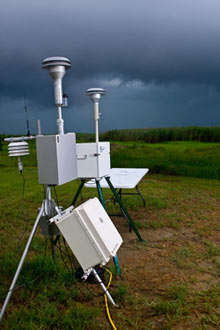
Air monitoring station near Grand Isle State Park, Grand Isle, Louisiana.
What EPA is Looking for in the Air
Particulate Matter (also known as Particulate Pollution)
EPA is measuring two sizes of particulate matter, also called particle pollution: fine particles (PM2.5), which are smaller than 2.5 micrometers in diameter; and coarse particles (PM10), which are smaller than 10 micrometers in diameter.
EPA's Air Quality Index (AQI) tracks levels of fine particulate matter (PM2.5) and ozone along the Gulf. These data are available publicly daily http://www.airnow.gov/ and http://gulfcoast.airnowtech.org/.
In addition to monitors used to provide data for EPA's AQI, EPA's emergency response teams also put up monitoring stations that monitor specifically for larger particulate matter (PM-10).
It is not uncommon to see elevated levels of PM or ozone along the coast at this time of year from other man-made sources (factories, power plants, cars, etc.). Therefore, you may see elevated levels of PM along the Gulf -- in the moderate range, for example -- but those levels are not elevated because of the presence of the oil. The only time that the BP Gulf spill might affect levels of PM along the coast is when the oil is being burned.
Key to daily averages and air quality levels
| Localized Monitoring PM10 Daily Averages |
Index Value | Air Quality Index Levels of Health Concern |
Cautionary Statements |
|---|---|---|---|
| 0-54 | 0 to 50 | Good | None |
| 55-154 | 51 to 100 | Moderate | Unusually sensitive people should consider reducing prolonged or heavy exertion. |
| 155-254 | 101 to 150 | Unhealthy for Sensitive Groups | People with heart or lung disease, older adults, and children should reduce prolonged or heavy exertion. |
| 255-354 | 151 to 200 | Unhealthy | People with heart or lung disease, older adults, and children should avoid prolonged or heavy exertion. Everyone else should reduce prolonged or heavy exertion. |
| 355-424 | 201 to 300 | Very Unhealthy | People with heart or lung disease, older adults, and children should avoid all physical activity outdoors. Everyone else should avoid prolonged or heavy exertion. |
| 425-604 | 301 to 500 | Hazardous | People with heart or lung disease, older adults, and children should remain indoors and keep activity levels low. Everyone else should avoid all physical activity outdoors. |