EPA Response to BP Spill in the Gulf of Mexico
Mobile Air Monitoring on the Gulf Coast: TAGA Buses
In response to the BP oil spill, EPA monitored air, water, sediment, and waste generated by the cleanup operations. Ongoing response and restoration efforts are posted to RestoreTheGulf.gov.
While emergency response data collection has ended, results continue to be available on this site. Any new data will continue to be posted to this site, and data will continue to be available here for the foreseeable future.
Much of the content of this site continues to be available for historical and information purposes, but we are no longer updating these pages on a regular basis.
Trace Atmospheric Gas Analyzers (TAGA)
In addition to the stationary air monitors that provide information on chemicals or compounds in the air, EPA has also mobilized the Trace Atmospheric Gas Analyzer (TAGA) buses, self-contained mobile laboratories that conduct instant-result monitoring of air quality at particular locations.
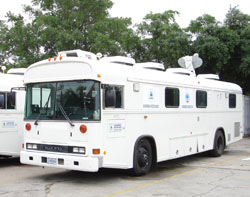
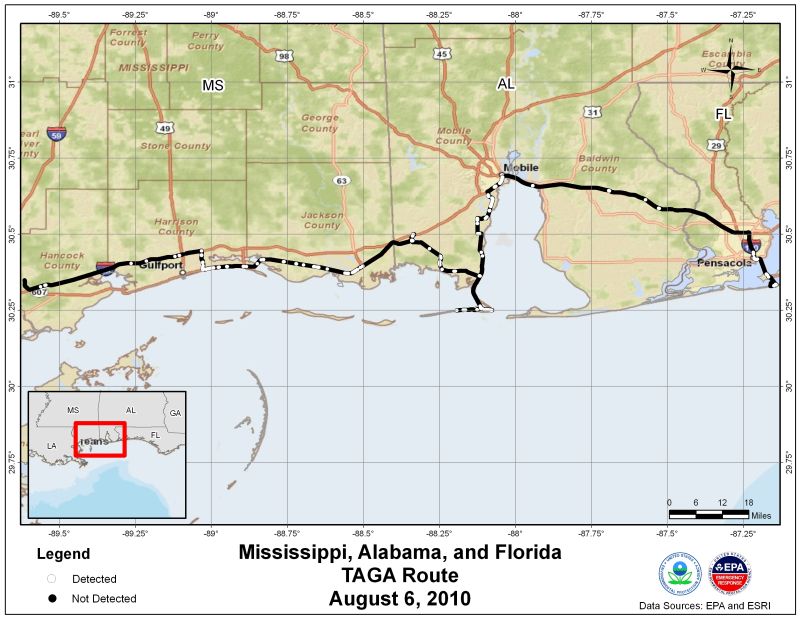
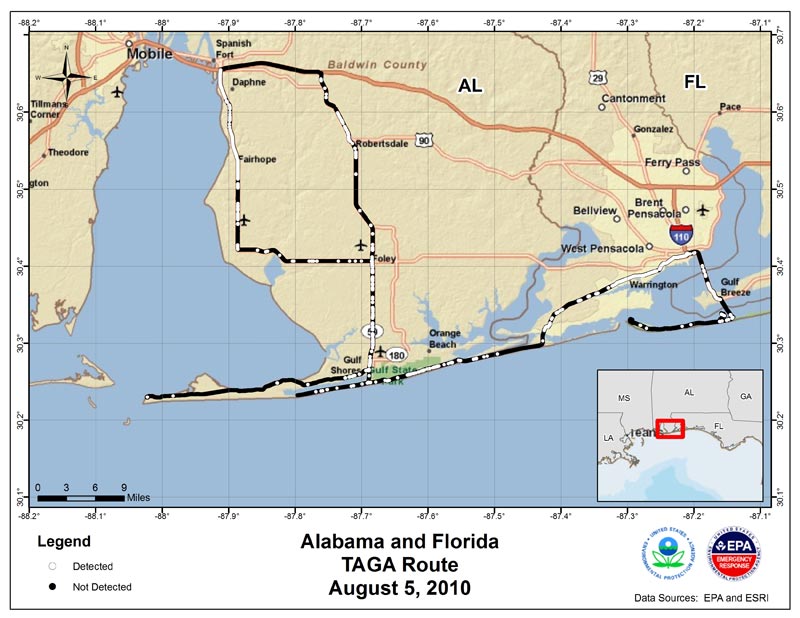
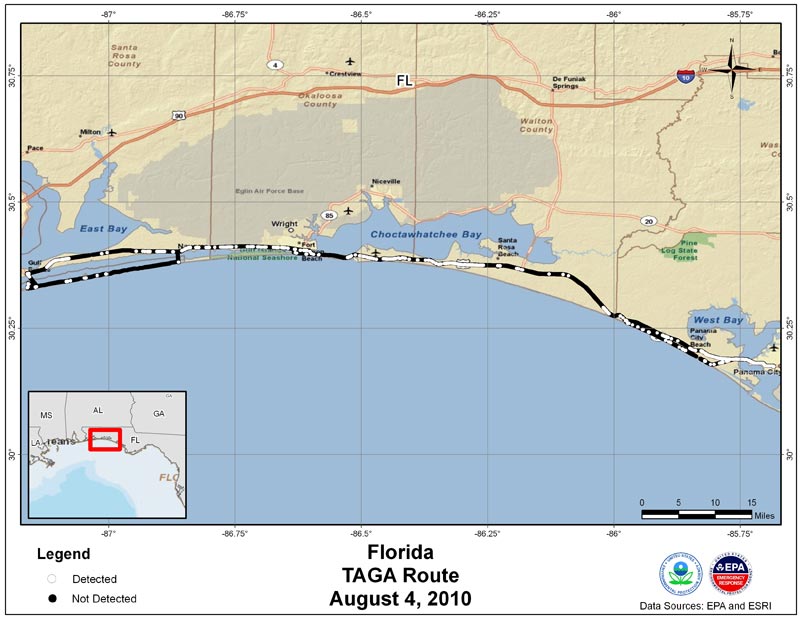
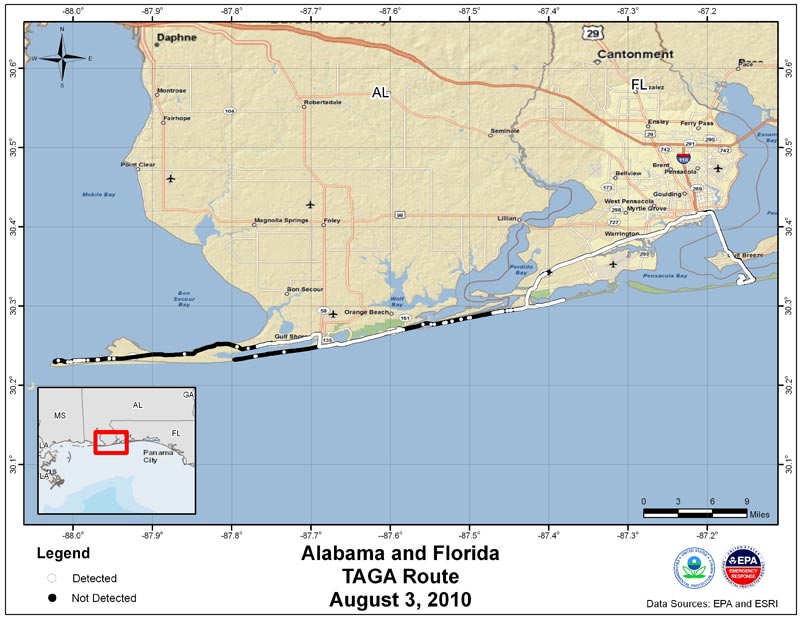
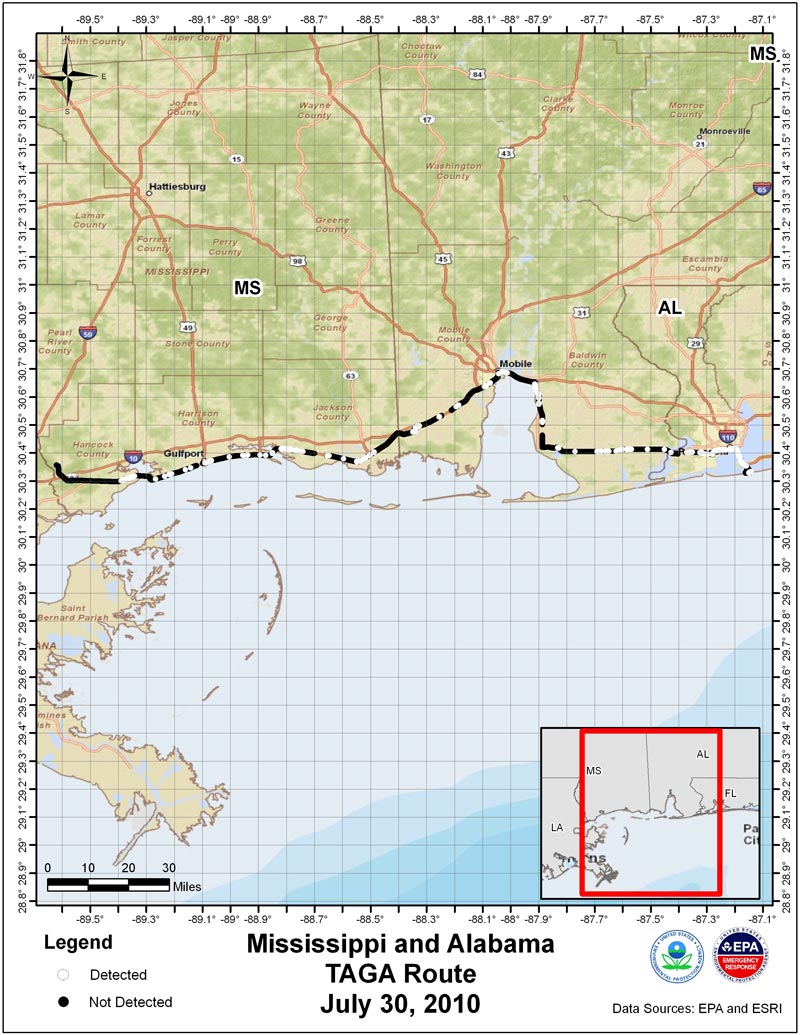
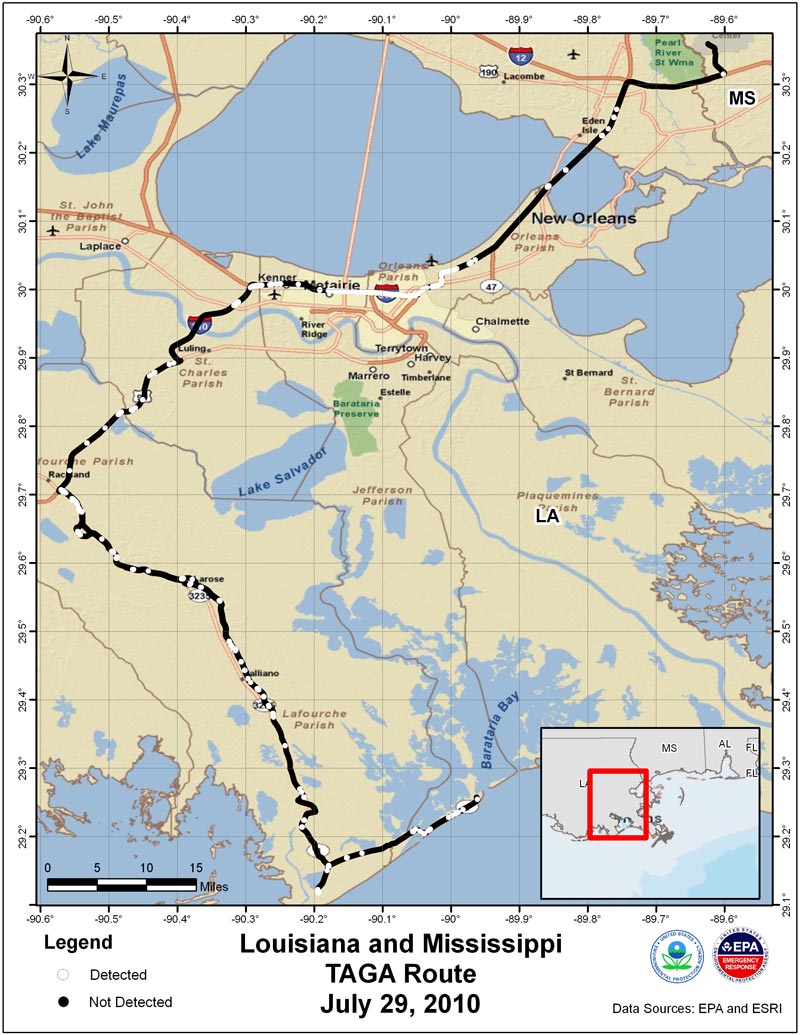
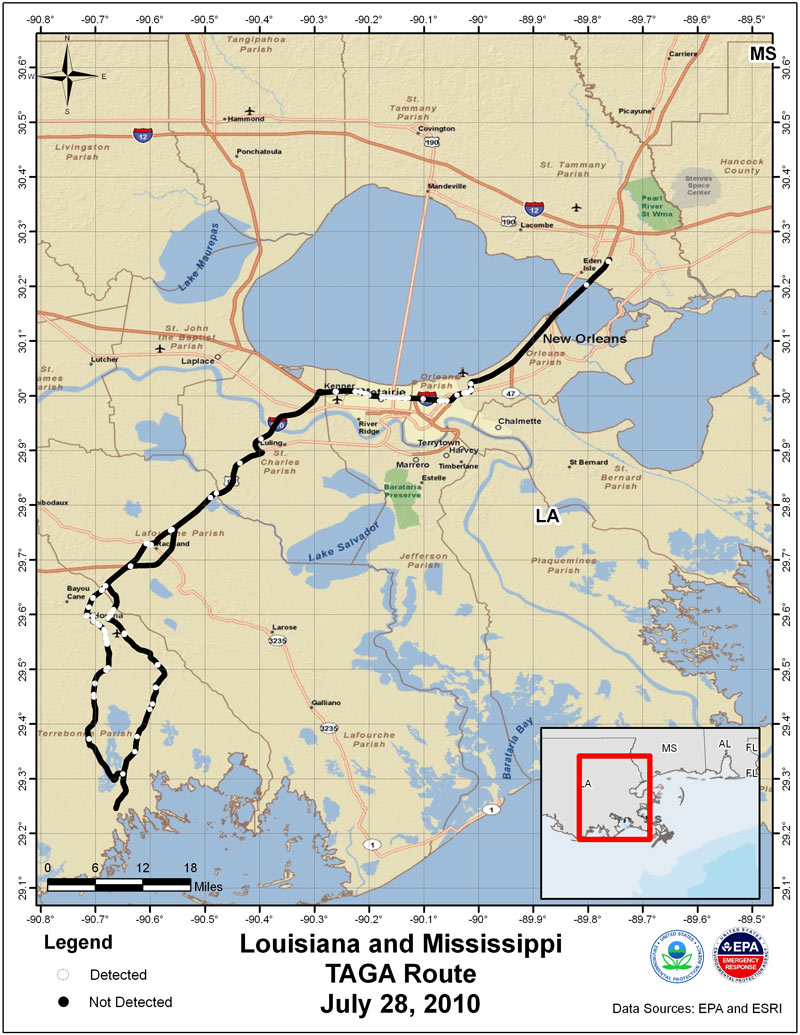
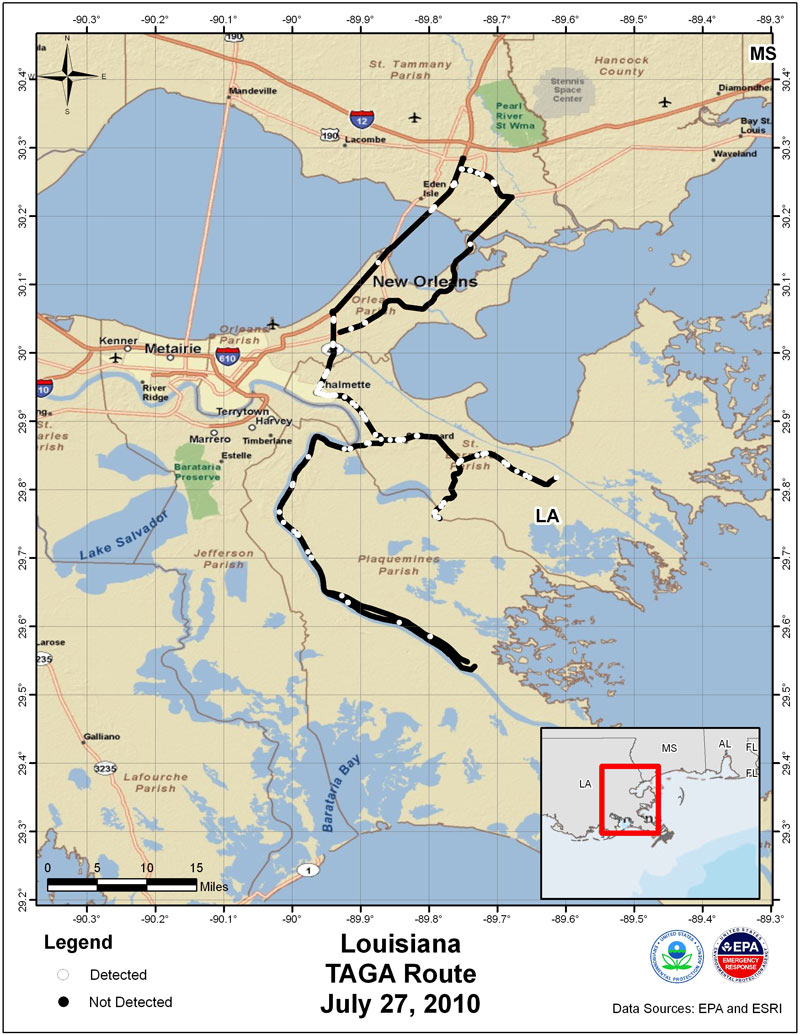
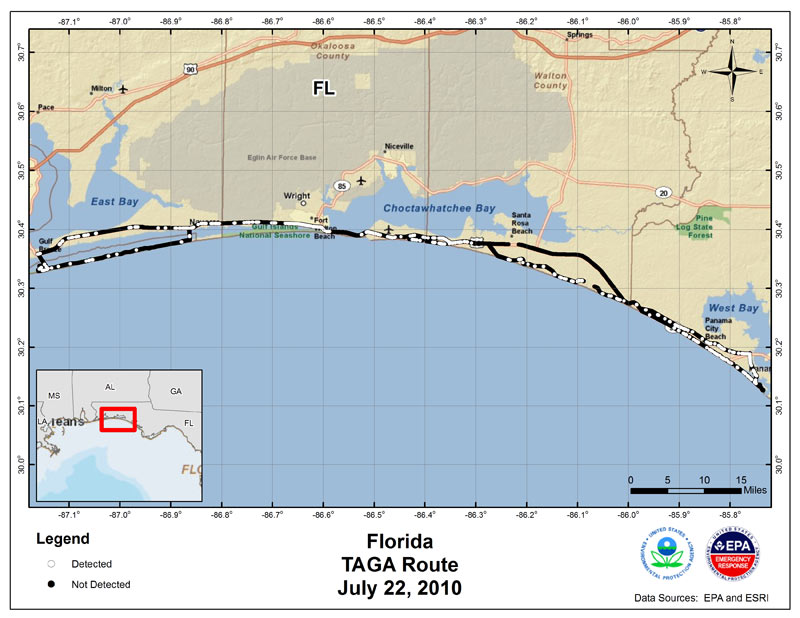
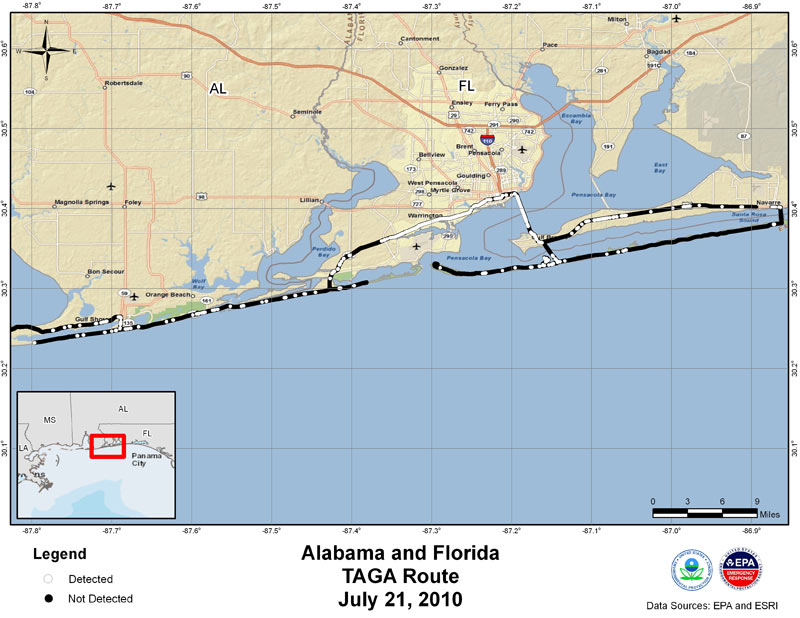
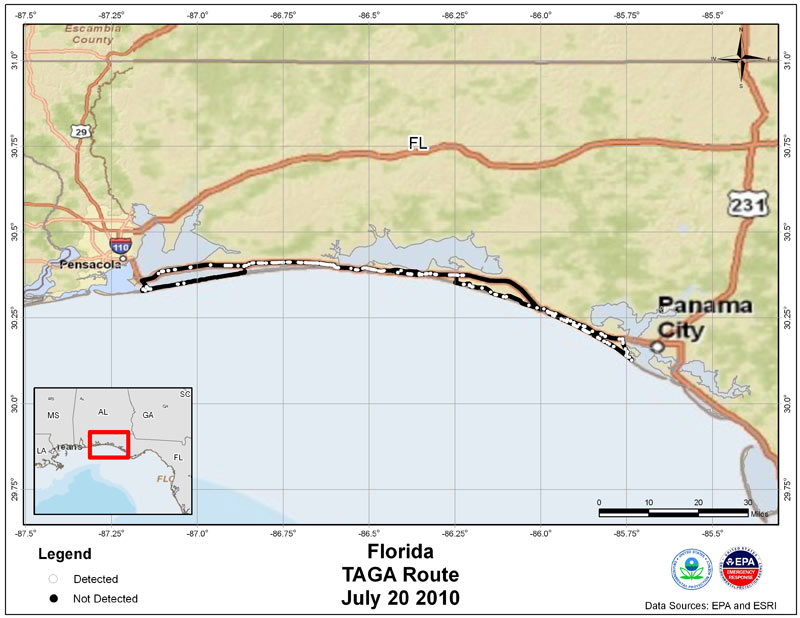
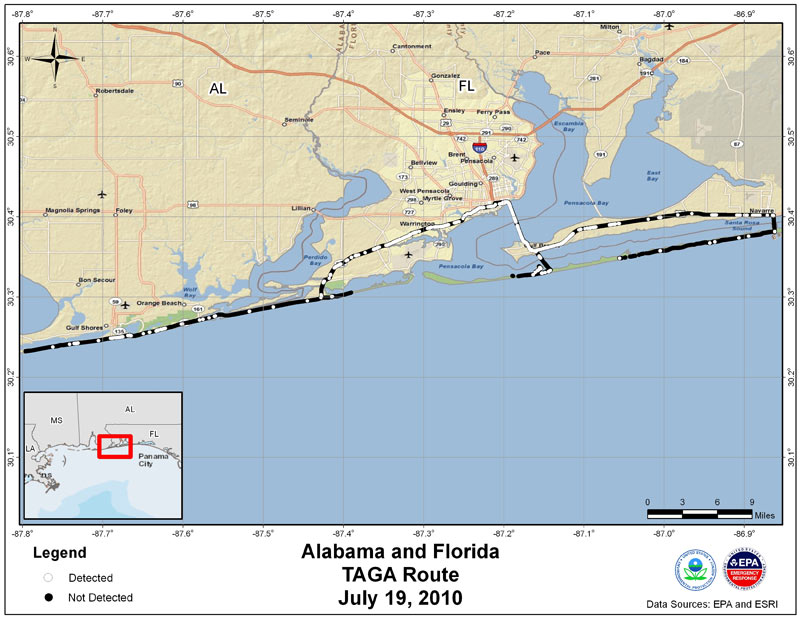
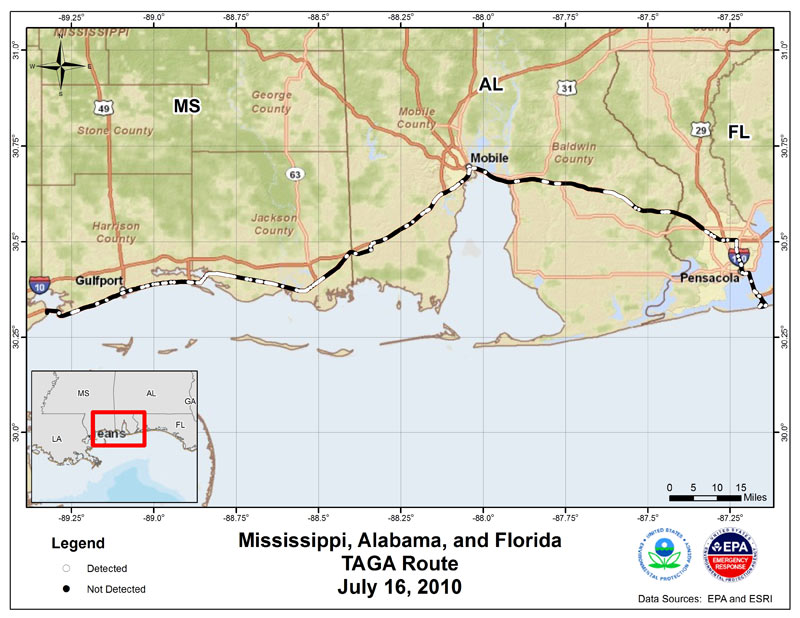
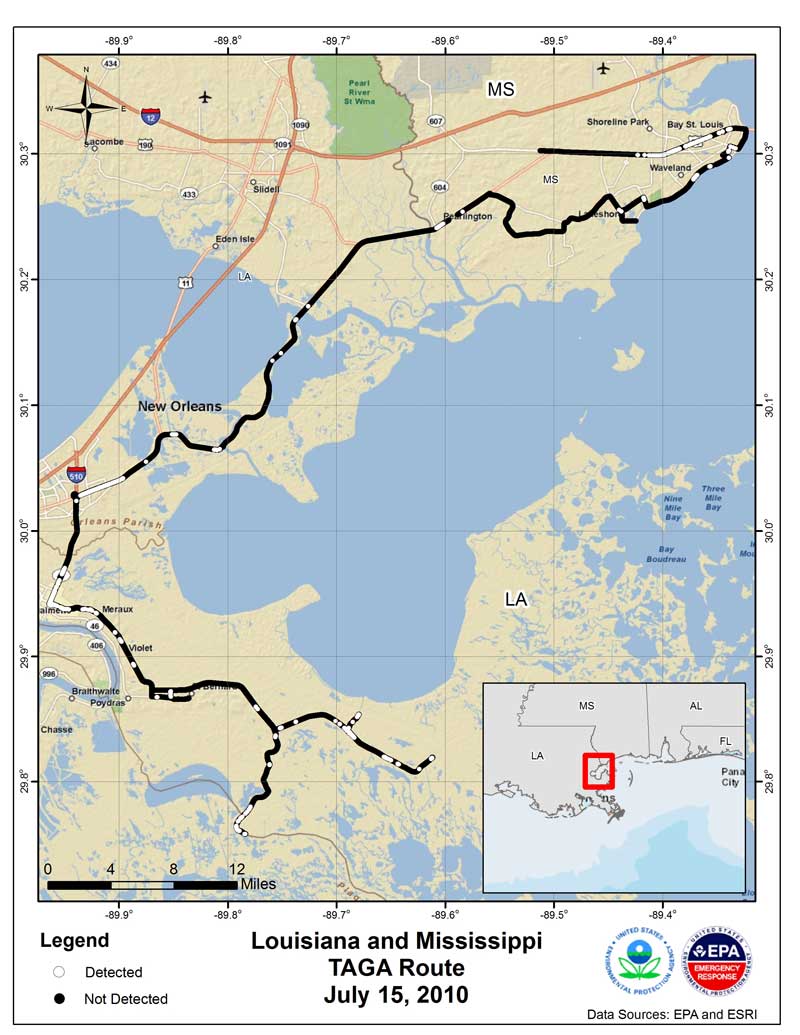
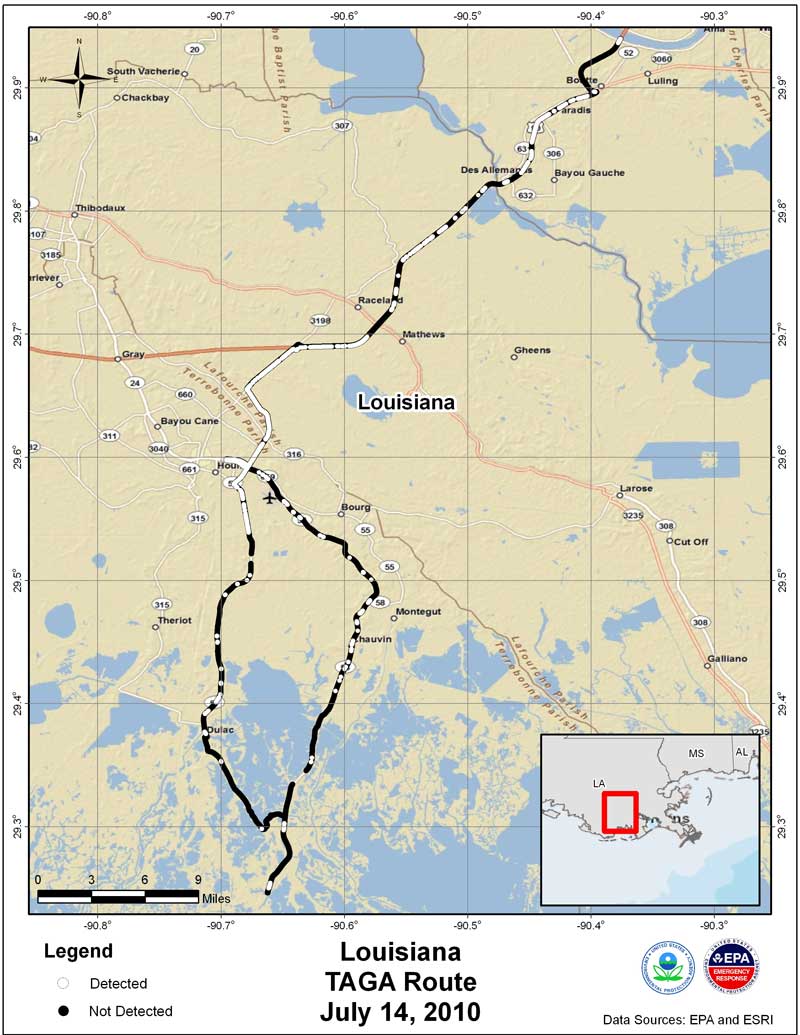
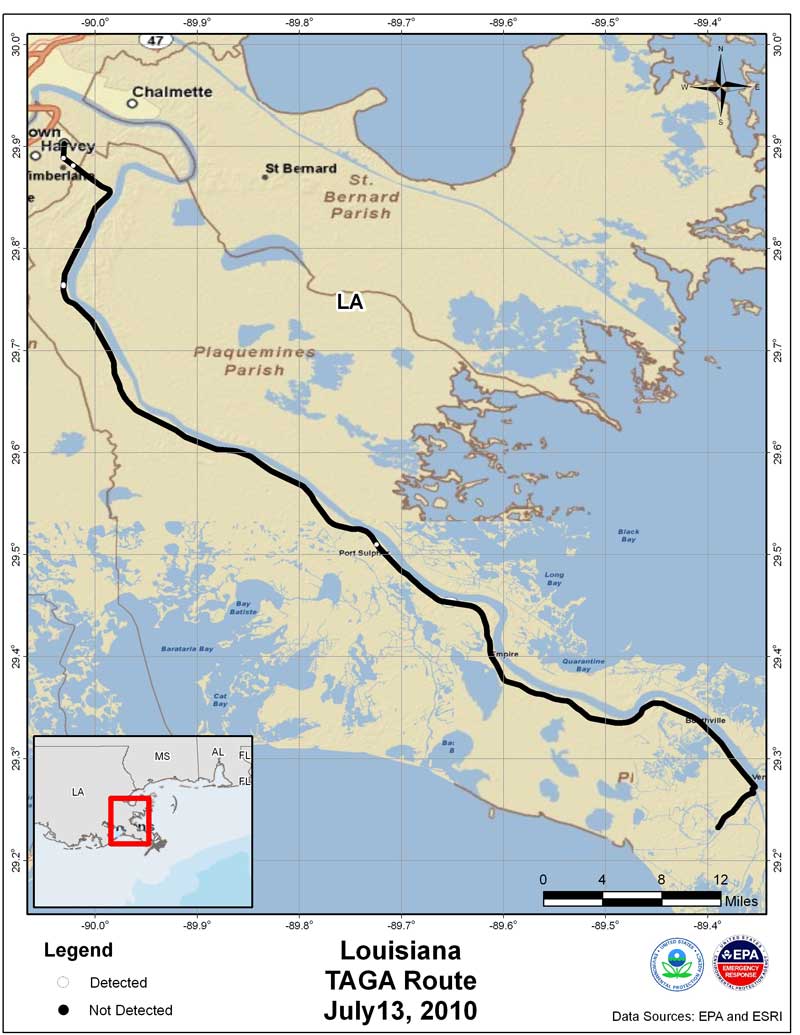
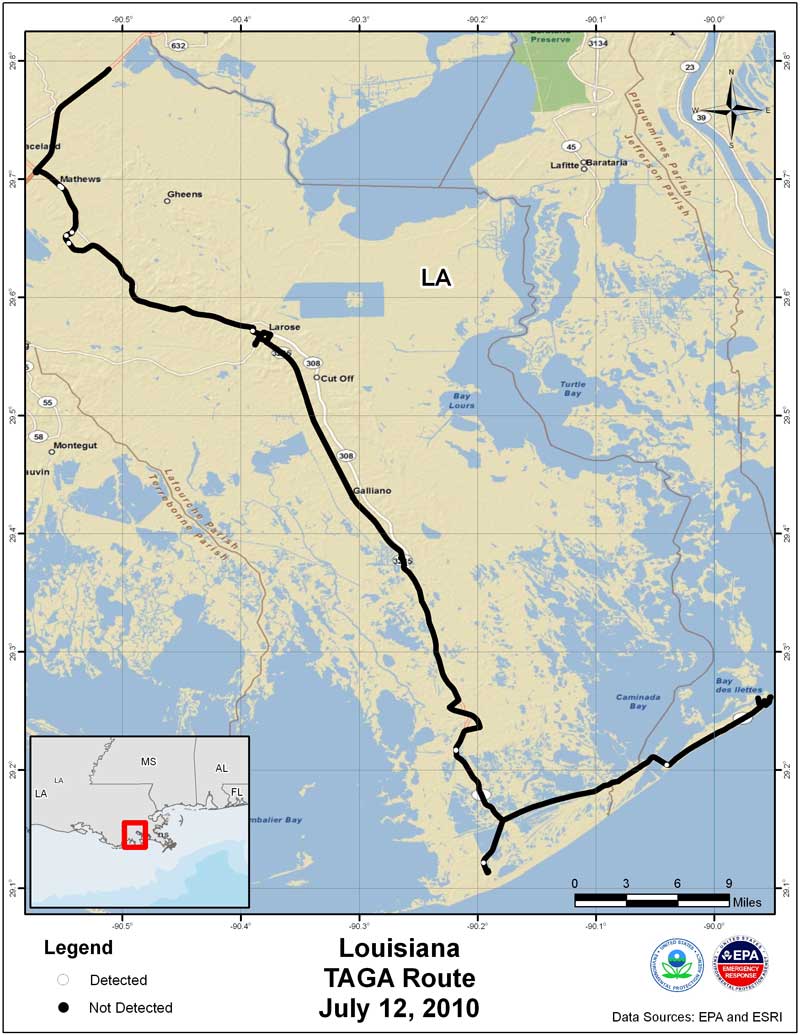
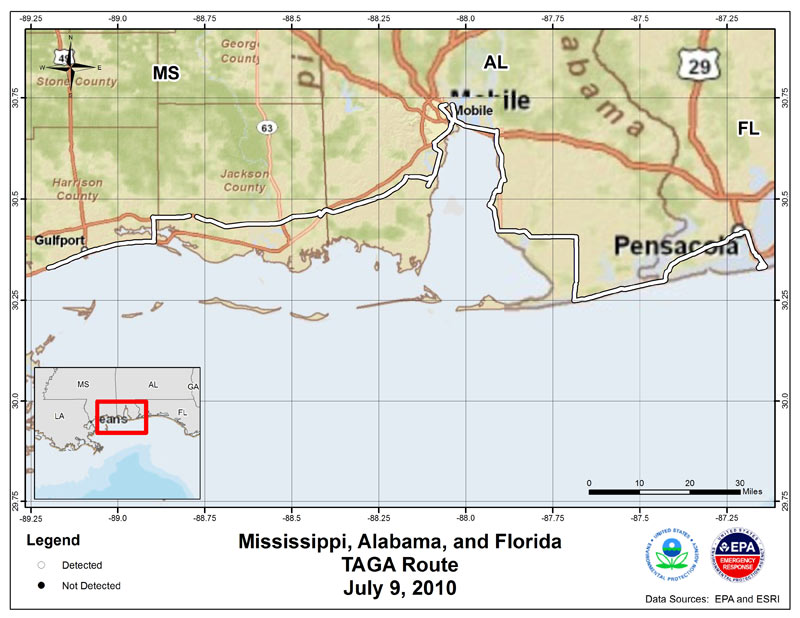
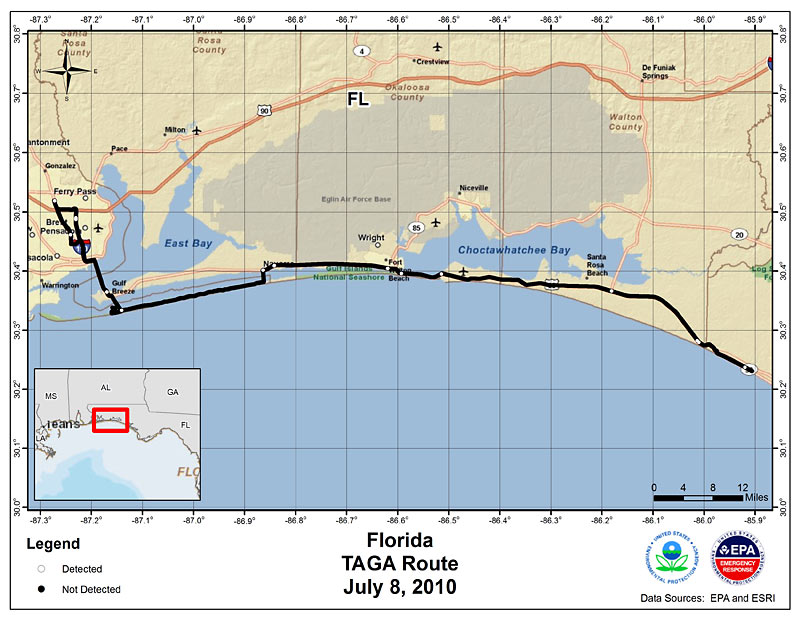
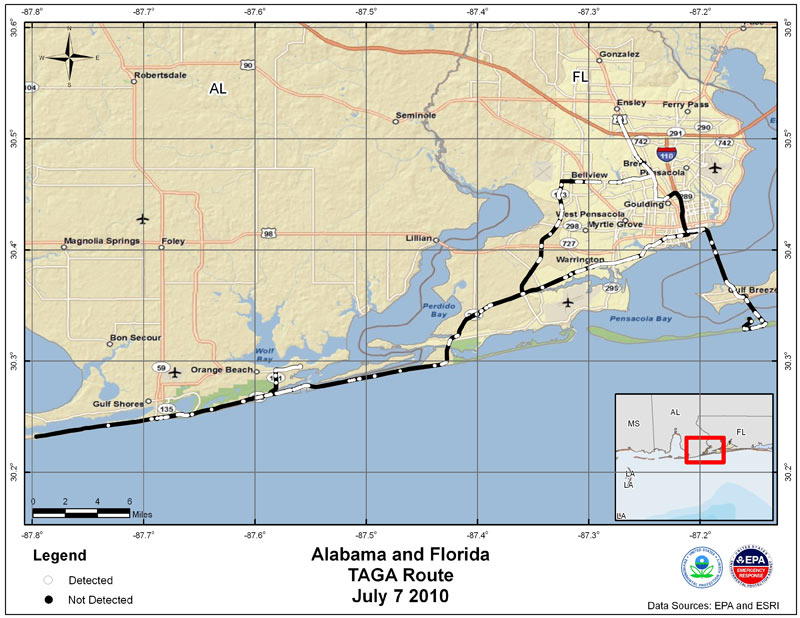
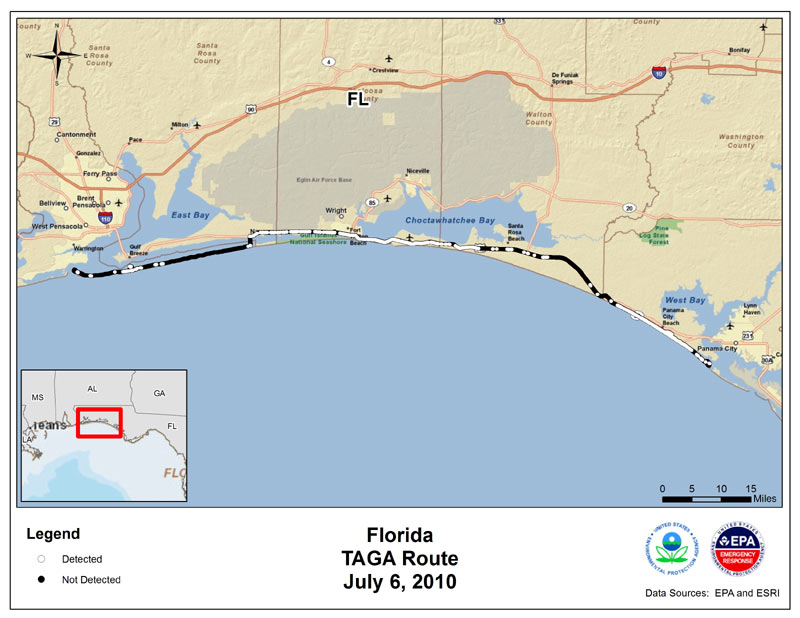
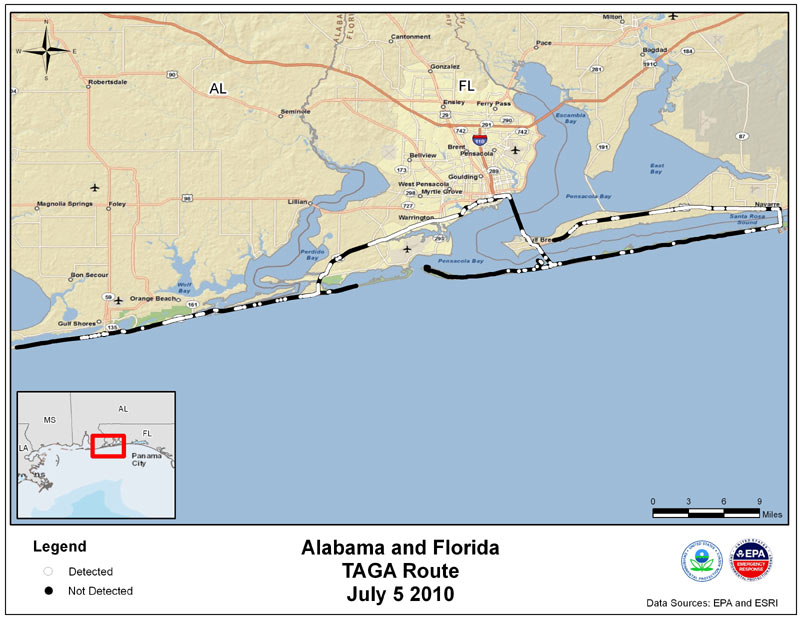
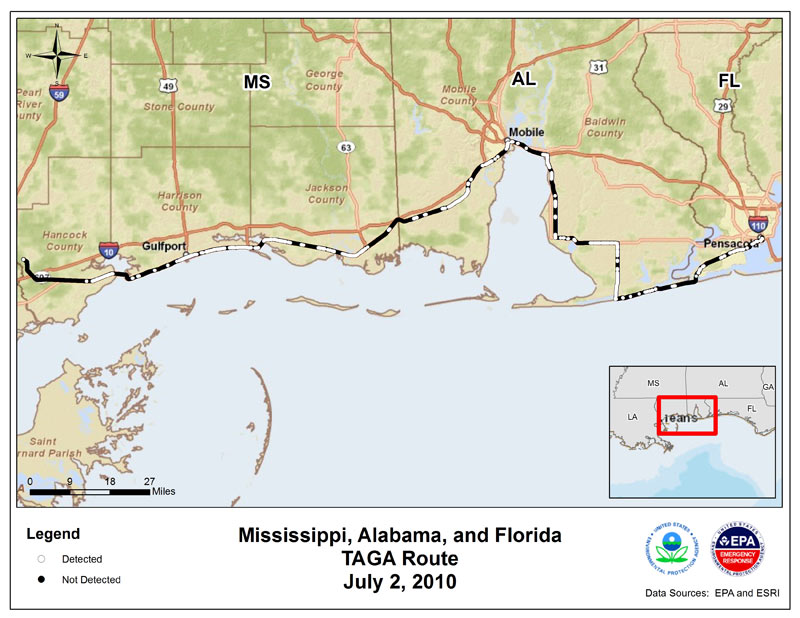
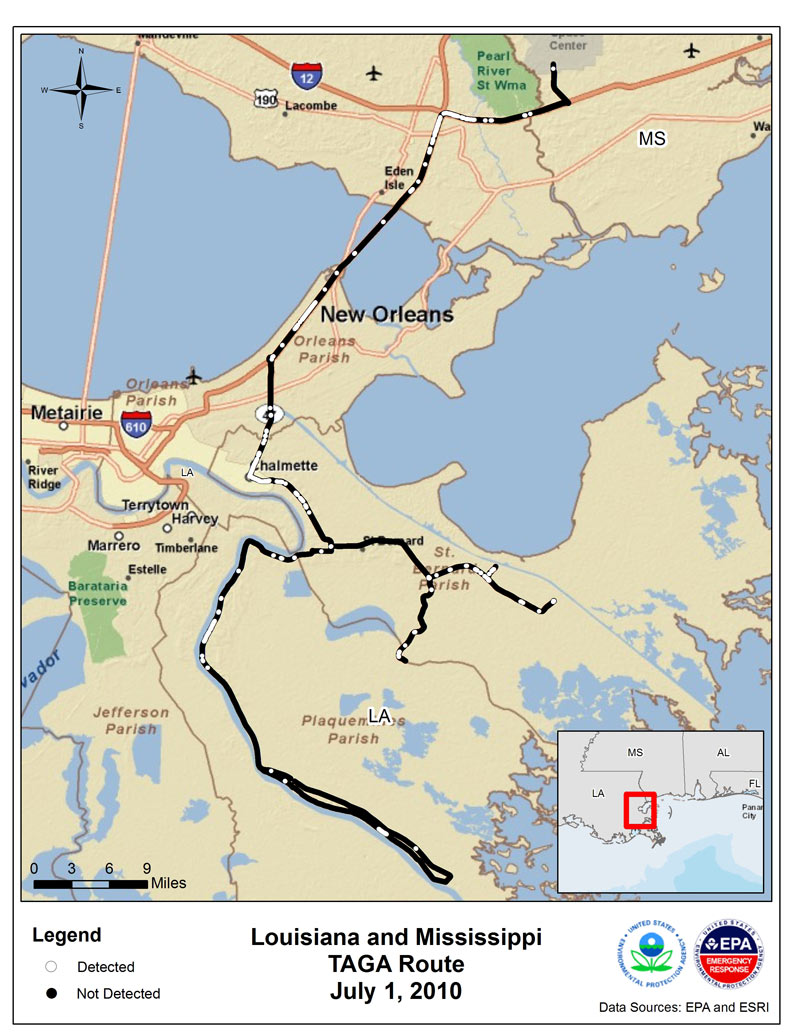
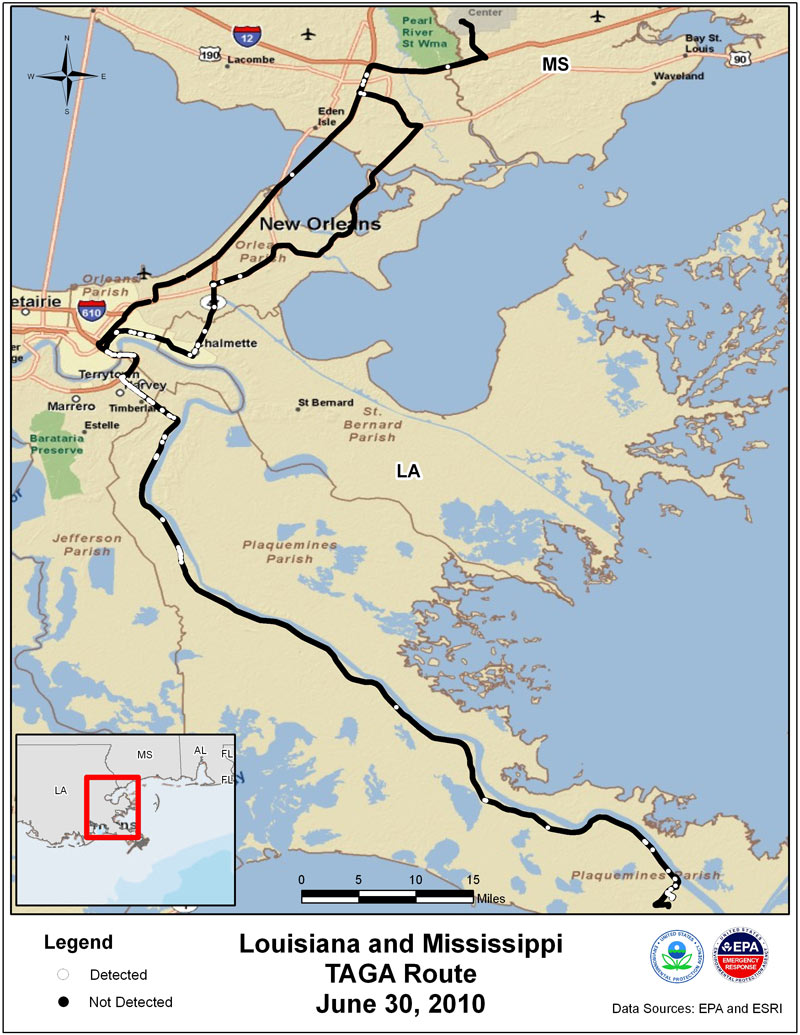
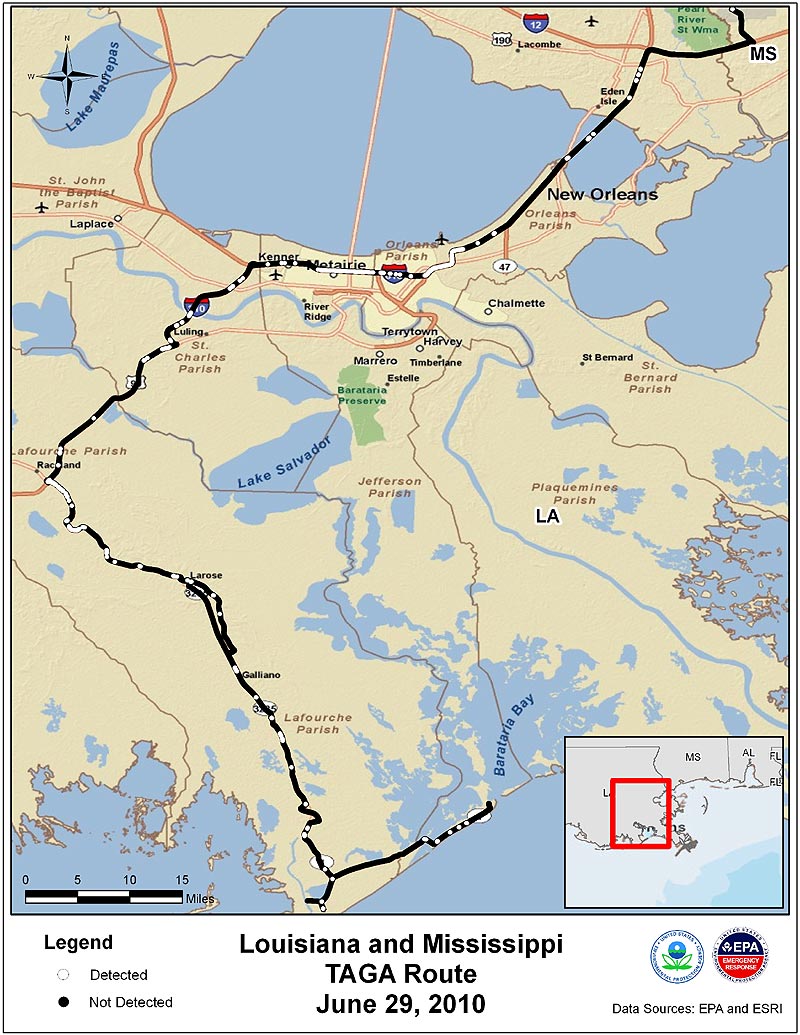
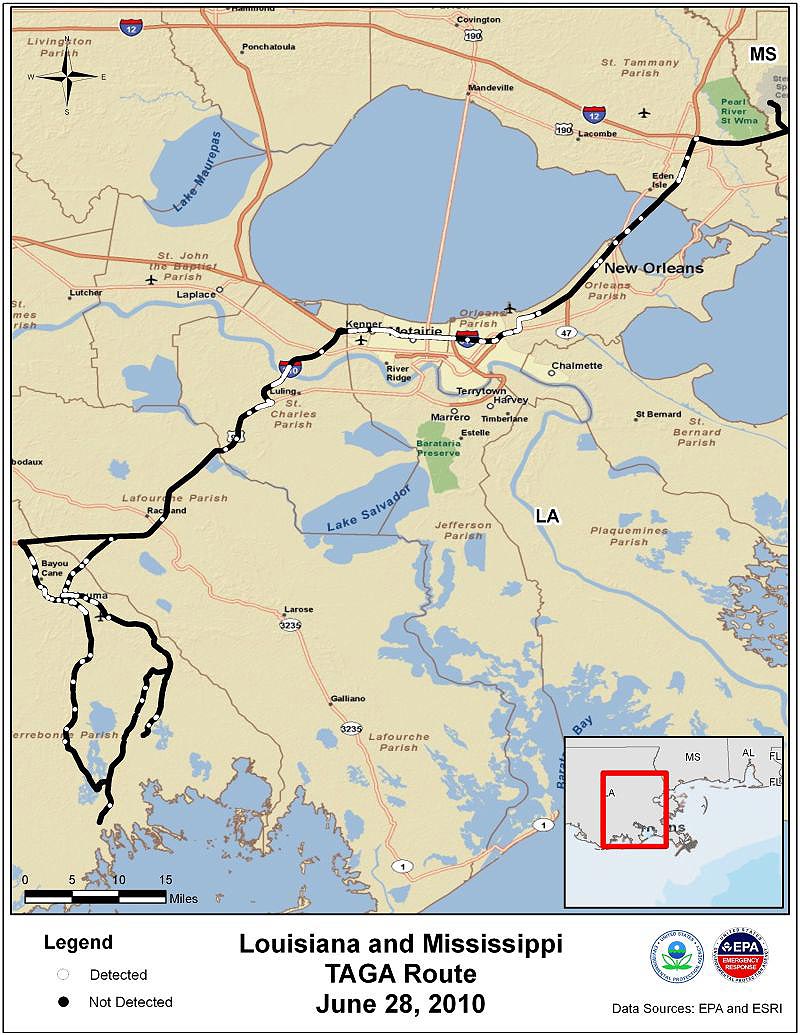
The TAGA bus analyzes the air along the Gulf Coast in response to the BP oil spill
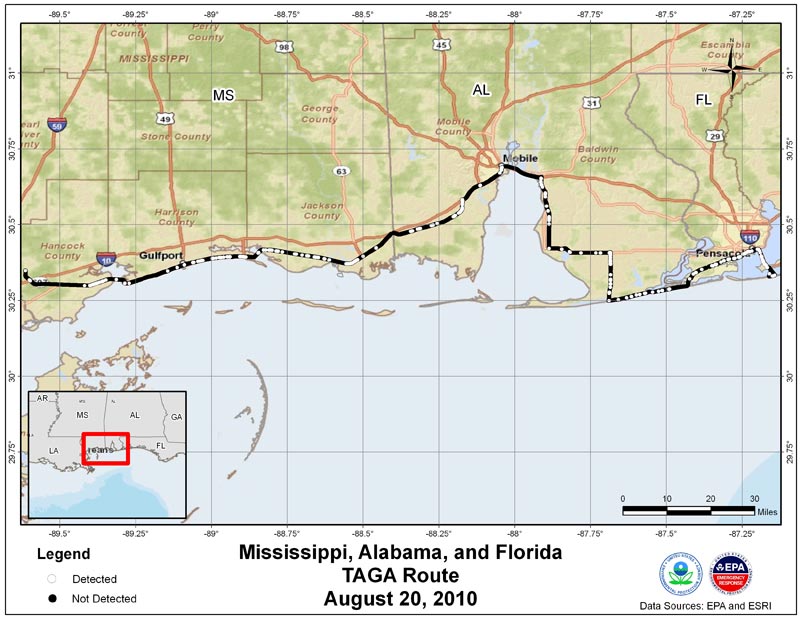
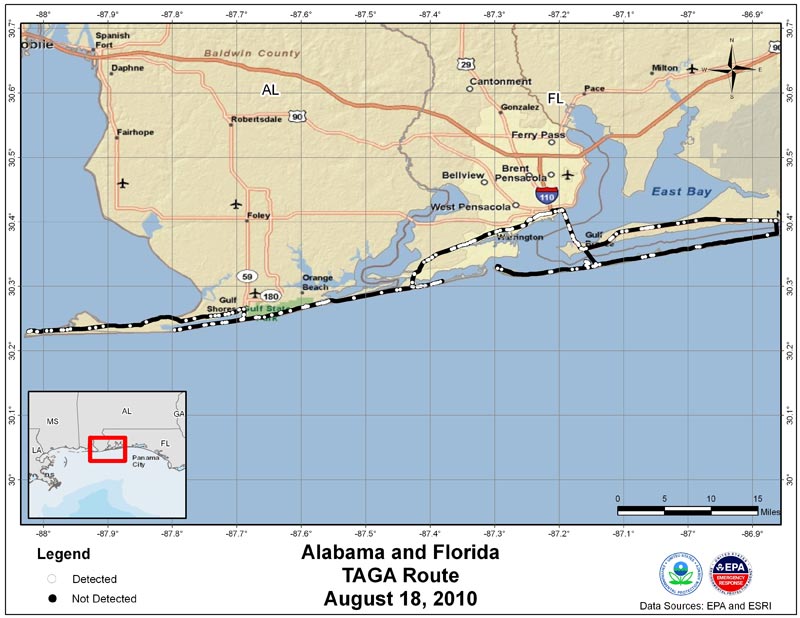
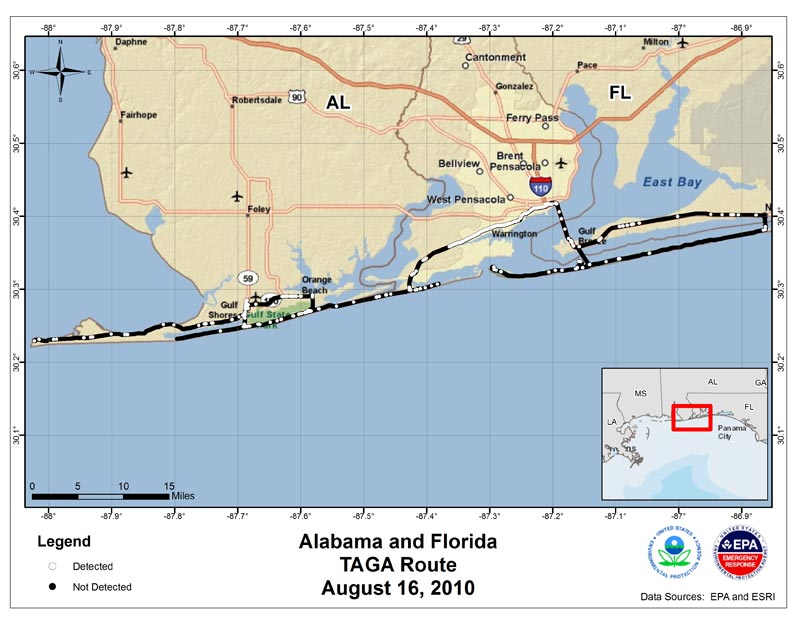
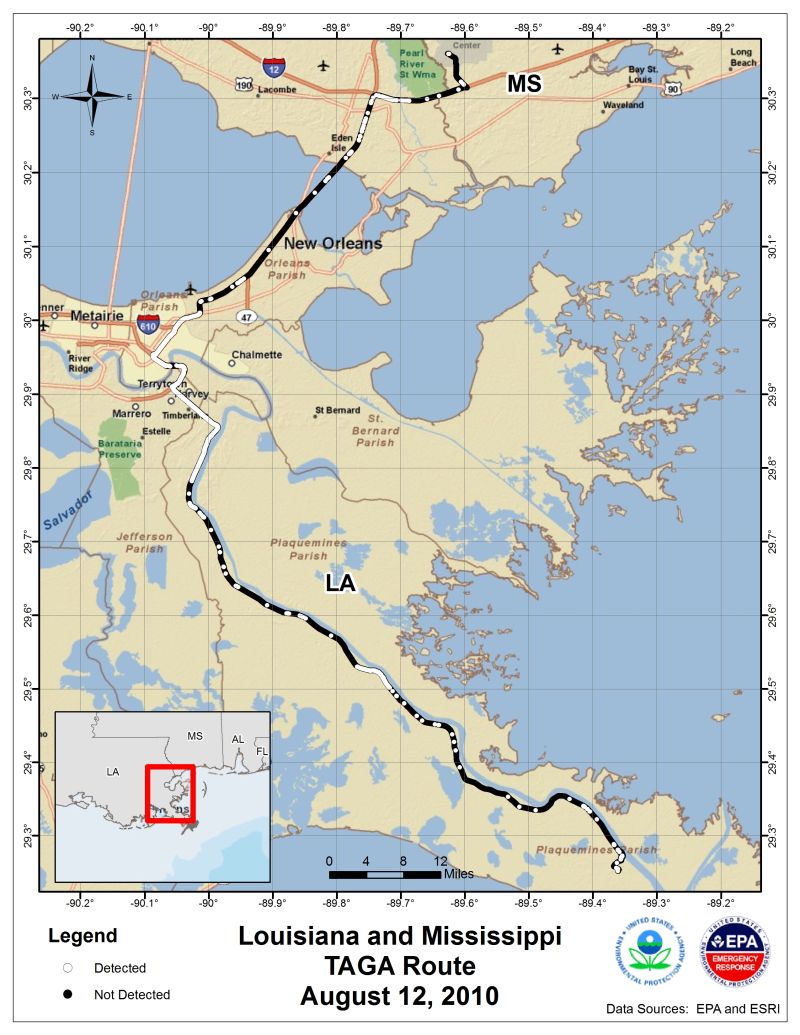
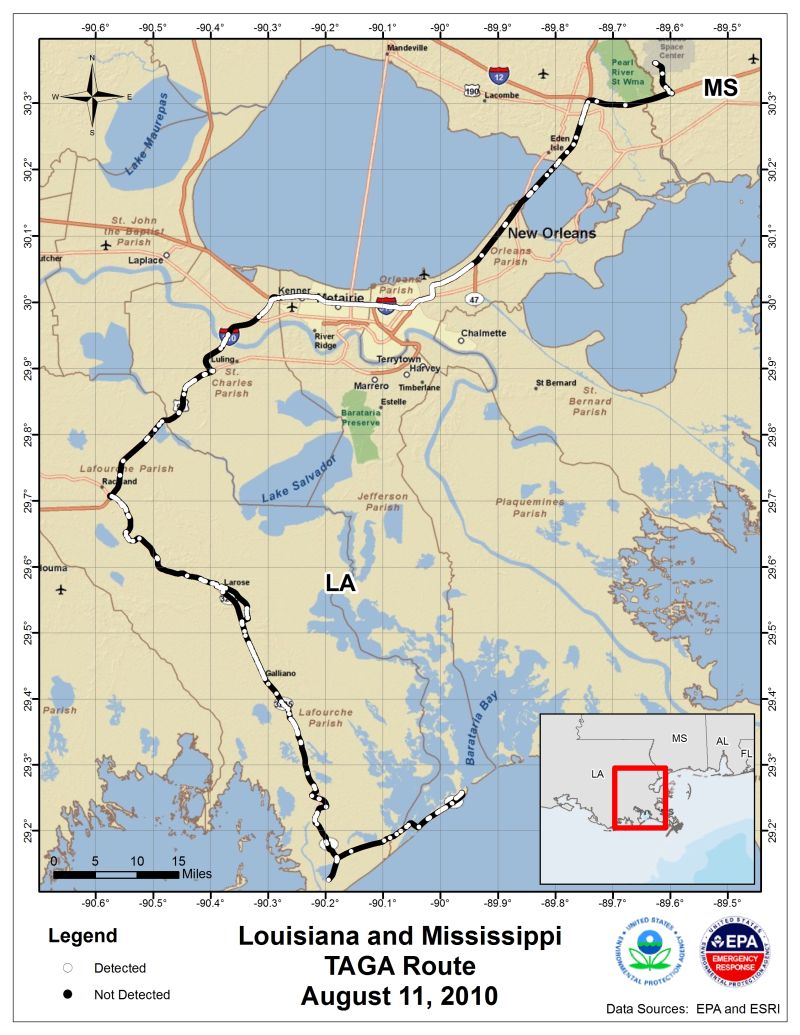
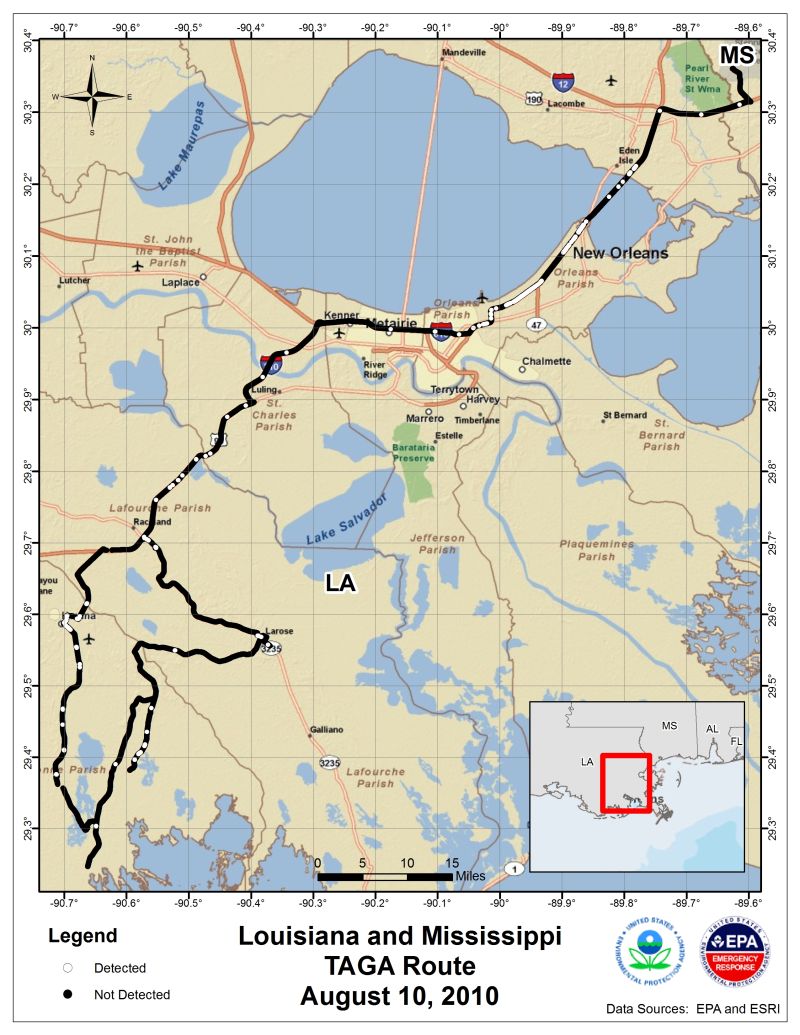
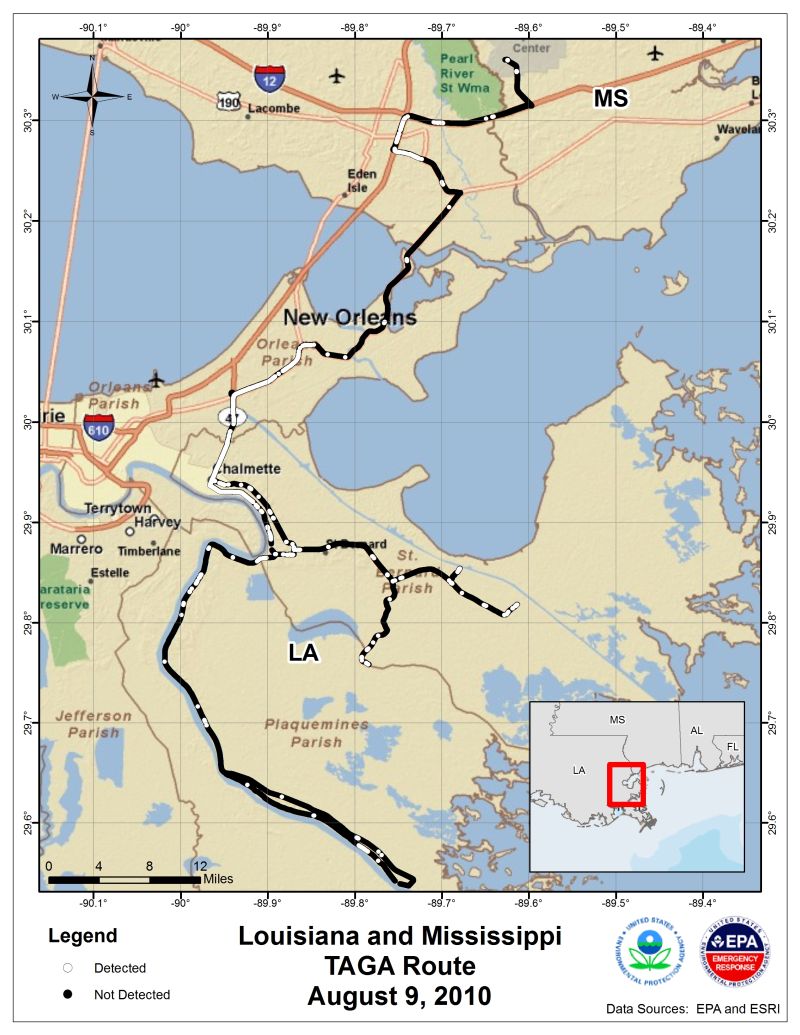
- View maps of the TAGA route along the Gulf Coast and data from the buses
- View a slideshow about TAGA buses' capabilities during emergencies
The TAGA buses have monitored:
- Air toxics found in crude oil that may evaporate from the spill into the air, and
- Chemicals from dispersants that have the highest potential to get into the air in any significant amounts.
TAGA Monitoring for VOCs
Equipment in the TAGA buses is monitoring for air toxics known as volatile organic compounds (VOCs). The specific VOCs being monitored are benzene, toluene, and xylene. These substances are also associated with facilities such as gas stations, oil refineries, paper mills, and autobody shops. The TAGA monitoring has found that these substances are not present or are being detected at low levels in the areas monitored along the Gulf Coast and in New Orleans, LA. The levels found have been well below levels that would cause temporary discomfort, irritation, or other minor effects. View the data below.
TAGA Dispersant Air Monitoring
From May 18-June 6, 2010, EPA’s TAGA buses monitored for the two chemicals found in the COREXIT dispersants that have the highest potential to get into the air in any significant amounts: EGBE (2-butoxyethanol) and dipropylene glycol monobutyl ether. In addition to being found in the COREXIT dispersants, these compounds are found in cleaning products and coatings. As a result, we have not beeen able to identify the source of the measured compounds.
The TAGA buses detected very low levels of these chemicals in the air, at a limited number of the locations sampled along the Gulf Coast. The levels found were well below those that are likely to cause health effects, and suggest that the use of dispersants on the oil spill would not have a significant impact on air quality on land. View the data below.
You will need Adobe Reader to view some of the files on this page. See EPA's PDF page to learn more.
TAGA air toxics (VOCs) and dispersant monitoring results
Note: TAGA bus uses Greenwich Mean Time (GMT) because the bus can travel through several time zones in a day. Refer to the table below to calculate your local time.
| Time Zone | Standard Time | Daylight Savings Time |
|---|---|---|
| Eastern Standard Time | GMT -5 hrs | GMT -4 hrs |
| Central Standard Time | GMT -6 hrs | GMT -5 hrs |
Note: Values labeled "Xylene" in the Air Toxics spreadsheets may also include Ethylbenzene. Instrumentation used on the TAGA bus cannot distinguish between these two similar chemicals.
Government Response
- RestoreTheGulf.gov: official federal government site for spill response and recovery
Other federal government information:
Connect with us:
Facebook: EPA
Twitter: EPA
Photos: BP Spill | more photos
Get email updates
How EPA Analyzed the Data
Use of the TAGA mobile laboratory allows us to perform real-time (second-by-second) monitoring of the air up and down the coastal areas nearest to the spill and pick up any early indication of these chemicals in on-shore air.
EPA's general approach to evaluating any TAGA mobile lab detections of chemicals such as EGBE (also known as 2-butoxyethanol) and dipropylene glycol mono butyl ether is to compare the second-by-second TAGA air measurements to low health-based screening concentrations. This comparison allows us to identify measurements that we will closely evaluate.
When the measured concentrations are below the screening level, we conclude that the chemical is not present at levels that warrant further attention.
If the measured concentration is above the health-based screening level, we would investigate further. We would look at how high the concentration is above the screening level and for how long the concentration is above the screening level. We also would examine information for that pollutant, and the situations in which it might cause health problems. In addition, we would look at information about the winds in the area to understand whether the air monitored originated in the Gulf or from somewhere on shore. Based on this further investigation, we would determine whether follow-up actions would be needed. Possible follow-up actions include conducting additional monitoring to better assess the source of the pollutant, or to track the pollutant concentration over time. We might also collect air samples using other methods to assess the potential for human exposures that may be a health concern. If there is cause for immediate concern, we will work with state and local officials to determine necessary steps to protect the public health and work with the news media to notify the public.
Screening Levels
The very low screening levels we used for screening the TAGA second-by-second measurements are the EPA inhalation reference concentrations (RfC). An RfC is an air concentration a person can breathe continuously over a lifetime without an appreciable risk of health problems. EPA develops RfCs based on toxicity information about a chemical. RfCs are peer-reviewed by experts inside and outside the EPA. The lifetime RfCs are used in this analysis of second-by-second data simply to provide a very low screening level to target measurements for a closer look. In any closer look, EPA will analyze the longer data record using health based concentrations relevant to time periods over which people might be exposed.
For more information on RfCs see www.epa.gov/iris/help_ques.htm#rfd.
EGBE
For EGBE, EPA compared the instantaneous TAGA mobile lab measurements to the EPA's inhalation reference concentration (RfC) of 330 parts per billion (ppb). The highest TAGA lab's second-by-second EGBE measurement to date is well below 330 ppb.
Dipropylene Glycol Mono Butyl Ether
There is limited toxicity information available for dipropylene glycol mono butyl ether, and there is no RfC. However, the compound is one of the class of compounds known as glycol ethers, which have similarities in chemical structure. In the absence of a specific RfC, we used the RfC for the most toxic glycol ether for which we have such a value. This allows us to identify a low screening level, which is our purpose here. This is 7 ppb, the reference concentration for ethylene glycol monomethyl ether. The current highest second-by-second concentration of dipropylene glycol mono butyl ether is well below 7 ppb.
For More Information:
For more information on the EGBE RfC see www.epa.gov/ncea/iris/subst/0500.htm#refinhal
For more information on the ethylene glycol monomethyl ether RfC, see www.epa.gov/iris/subst/0640.htm#refinhal