Pacific Southwest, Region 9
Serving: Arizona, California, Hawaii, Nevada, Pacific Islands, Tribal Nations
Naturally Occurring Asbestos
El Dorado Hills
Multimedia Exposure Assessment
Preliminary Assessment and Site Inspection Report Interim Final
5.0 Summary of Investigative Efforts (cont'd)
5.4 Air Sampling
5.4.2.5 New York Creek Nature Trail
The START conducted activity-based outdoor air sampling during one biking and two jogging/walking scenarios along the New York Creek Nature Trail. The trail was officially closed to public use during the activity-based sampling, but a few members of the public did enter the trail during sampling in spite of its closure.
The plan for the trail scenarios, as described in the El Dorado Hills Naturally Occurring Asbestos Multimedia Exposure Assessment, El Dorado Hills, California, Activity-Based Outdoor Air Sampling of Community Park and Schools Field Sampling Plan, had called for the START to conduct three jogging/walking scenarios. Changes to the schedule for sampling at Silva Valley Elementary School impacted the schedule for scenarios that had been planned for the following day, necessitating that one of the three jogging/walking scenarios on the New York Creek Nature Trail be dropped.
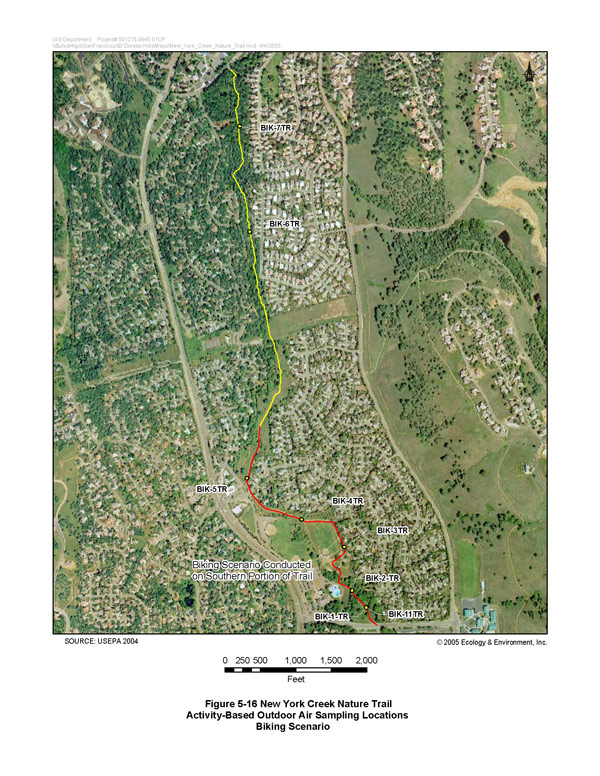
Biking Scenario. During the biking scenario on the New York Creek Nature Trail, five members of the sampling team rode bicycles along the southern end of the trail from Harvard Way through the Community Park and slightly beyond its northern border at St. Andrews Drive. The START placed five high-flow stationary air sample pumps along the trail where the bicyclists rode. The START also placed two other high-flow stationary air sample pumps along the northern end of the trail where there was no activity from the bicyclists. The intakes for the high-flow stationary air sample pumps were positioned at a height of about 5 feet.
The START conducted the biking scenario on October 5, 2004, according to the following scripted schedule:
- For the entire 2-hour scenario, one member of the sampling team simulated the activities of an adult/parent walking and standing along the trail. The intake for the air collection filter cassette worn by this sampling team member was set at a height of about 5 feet.
- For the entire 2-hour scenario, five other members of the sampling team rode bicycles along the trail. The intakes for the air collection filter cassettes worn by these sampling team members were set at a height of about 3 feet. Four sampling team members rode in two separate pairs, and one rode alone, although the sets of riders passed one another periodically during the scenario. For the bicyclists who rode in pairs, the relative position (i.e., leader and follower) remained constant throughout the entire scenario. Table 5-21 (Biking Scenario Positions) shows the configuration of the bicyclists during the scenario.
The portion of the trail along which the START conducted the biking activity is shown and the positions of the stationary air sample pumps operating during the biking scenario are shown as BIK-1TR/BIK-11TR, BIK-2TR, BIK-3TR, BIK-4TR, BIK-5TR, BIK-6TR, and BIK-7TR on Figure 5-16 (New York Creek Nature Trail Activity-Based Outdoor Air Sampling Locations–Biking Scenario). A summary of results for the biking scenario samples is shown in Table 5-22 (New York Creek Nature Trail Biking Scenario Air Sample Summary Results). See Appendix B for a summary of the results from dust monitoring during this scenario.
Figure 5-16
New York Creek Nature Trail Activity-Based Outdoor Air Sampling Locations B
Biking Scenario
(Click image for larger version)
|
Table 5-22 New York Creek Nature Trail Biking Scenario Air Sample Summary Results |
||||||
| Sample ID | Location | Location Description | Date | PCME Structures (s/cc) | AHERA-like Total Structures (s/cc) | Sensitivity (s/cc) |
| BIK-H2-1TR-100504 | BIK-1TR | trail position #BIK1 hi-vol | 10/05/04 | 0.000986 | 0.00197 | 0.00986 |
| BIK-H2-11TR-100504 | BIK-1TR | duplicate of trail position #BIK1 hi-vol | 10/05/04 | 0.00192 | 0.00192 | 0.000960 |
| BIK-H2-2TR-100504 | BIK-2TR | trail position #BIK2 hi-vol | 10/05/04 | 0.00487 | 0.0107 | 0.000974 |
| BIK-H2-3TR-100504 | BIK-3TR | trail position #BIK3 hi-vol | 10/05/04 | 0.00200 | 0.00200 | 0.00100 |
| BIK-H2-4TR-100504 | BIK-4TR | trail position #BIK4 hi-vol | 10/05/04 | 0.00576 | 0.00864 | 0.000960 |
| BIK-H2-5TR-100504 | BIK-5TR | trail position #BIK5 hi-vol | 10/05/04 | 0.00482 | 0.00675 | 0.000965 |
| BIK-H2-6TR-100504 | BIK-6TR | trail position #BIK6 hi-vol | 10/05/04 | <0.00292 | 0.00293 | 0.000977 |
| BIK-H2-7TR-100504 | BIK-7TR | trail position #BIK7 hi-vol | 10/05/04 | 0.00100 | 0.0110 | 0.00100 |
| BIK-L2-1CH-100504 | BIK-1CH | child #1 | 10/05/04 | 0.0668 | 0.145 | 0.00145 |
| BIK-L2-2CH-100504 | BIK-2CH | child #2 | 10/05/04 | 0.00694 | 0.0228 | 0.000991 |
| BIK-L2-3CH-100504 | BIK-3CH | child #3 | 10/05/04 | 0.000998 | 0.0170 | 0.000998 |
| BIK-L2-13CH-100504 | BIK-3CH | duplicate of child #3 | 10/05/04 | 0.0140 | 0.0470 | 0.000999 |
| BIK-L2-4CH-100504 | BIK-4CH | child #4 | 10/05/04 | 0.0178 | 0.0426 | 0.000991 |
| BIK-L2-5CH-100504 | BIK-5CH | child #5 | 10/05/04 | 0.0309 | 0.0639 | 0.00101 |
| BIK-L2-1NA-100504 | BIK-1NA | non-active adult | 10/05/04 | 0.00198 | 0.00694 | 0.000992 |
|
PCME fibers = fibers longer than 5 microns with a width between 0.25 and 3 microns, and an aspect ratio (length to width) greater than 3:1 AHERA-like total structures = structures longer than 0.5 microns with an aspect ratio greater than 3:1 (Note this differs somewhat from the strict AHERA structure definition) Sensitivity = the sample-specific lowest concentration of asbestos the laboratory can reliably detect s/cc = structures per cubic centimeter |
||||||
Jogging/Walking Scenario A. During the first jogging/walking scenario on the New York Creek Nature Trail, five members of the sampling team jogged and walked along the entire length of the trail from Harvard Way through the Community Park and up to the end of the trail near Jackson Elementary School. The START placed five high-flow stationary air sample pumps along the length of the trail. The intakes for the high-flow stationary air sample pumps were positioned at a height of about 5 feet.
The START conducted the Jogging/Walking Scenario A on October 6, 2004, according to the following scripted schedule:
- For the entire 2-hour scenario, one member of the sampling team simulated the activities of an adult/parent walking and standing along the trail. The intake for the air collection filter cassette worn by this sampling team member was set at a height of about 5 feet.
- For the entire 2-hour scenario, five members of the sampling team simulated the activities of an adult/parent jogging and walking along the trail. The intakes for the air collection filter cassettes worn by these sampling team members were set at a height of about 5 feet. Three sampling team members jogged and walked in a group with one jogger in the lead position and two others following far behind (about 20 to 30 feet) but staying fairly close to one another. Two other sampling team members jogged as a pair close to each other.
- For each jogger/walker group of two or three sampling team members, the relative positions of the joggers remained the same throughout the scenario. That is, for the trio, the far leader, second leader, and follower remained in those positions throughout the entire scenario. For the pair, the leader and the follower remained in those positions. Table 5-23 (Positions for Jogging/Walking Scenario A) shows the configuration of the jogger/walkers during the first jogging/walking scenario.
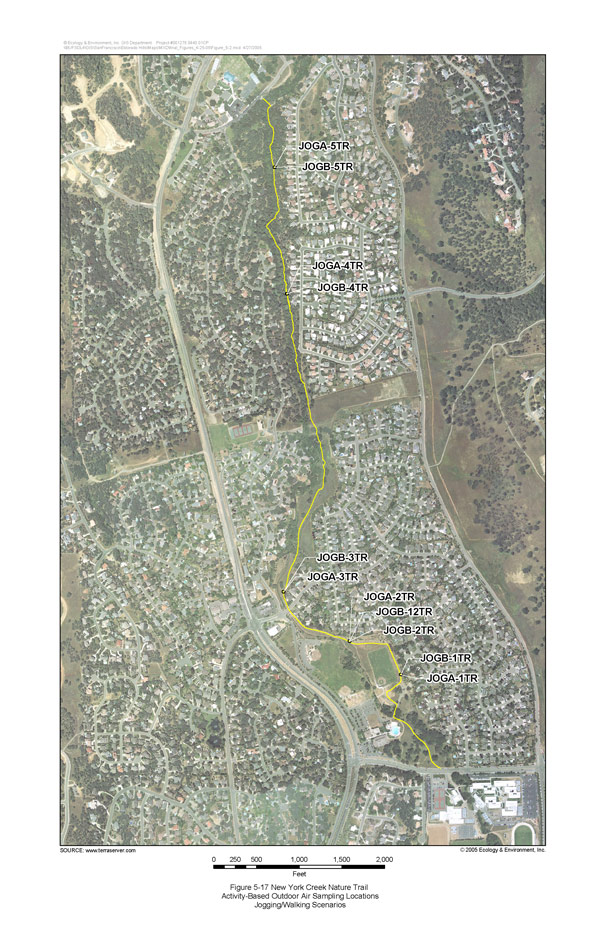
The entire length of the trail along which the START conducted the jogging/walking activity is shown and the positions of the stationary air sample pumps operating during Jogging/Walking Scenario A are shown as JOGA-1TR, JOGA-2TR, JOGA-3TR, JOGA-4TR, and JOGA-5TR on Figure 5-17 (New York Creek Nature Trail Activity-Based Outdoor Air Sampling Locations–Jogging/Walking Scenarios). A summary of results for Jogging/Walking Scenario A samples is shown in Table 5-24 (New York Creek Nature Trail Jogging/Walking Scenario A Air Sample Summary Results). See Appendix B for a summary of the results from dust monitoring during this scenario.
Jogging/Walking Scenario B. The START conducted the Jogging/Walking Scenario B on October 7, 2004, according to the same scripted schedule that was used for Jogging/Walking Scenario A. Table 5-25 (Positions for Jogging/Walking Scenario B) shows the configuration of the jogger/walkers during the second jogging/walking scenario.
Figure 5-17
New York Creek Nature Trail Activity-Based Outdoor Air Sampling Locations B
Jogging/Walking Scenarios
(Click image for larger version)
|
Table 5-24 New York Creek Nature Trail Jogging/Walking Scenario A Air Sample Summary Results |
||||||
| Sample ID | Location | Location Description | Date | PCME Structures (s/cc) | AHERA-like Total Structures (s/cc) | Sensitivity (s/cc) |
| JOGA-H2-1TR-100604 | JOGA-1TR | trail position #JOG1 hi-vol | 10/06/04 | 0.00198 | 0.0109 | 0.000992 |
| JOGA-H2-2TR-100604 | JOGA-2TR | trail position #JOG2 hi-vol | 10/06/04 | 0.00395 | 0.0128 | 0.000986 |
| JOGA-H2-3TR-100604 | JOGA-3TR | trail position #JOG3 hi-vol | 10/06/04 | 0.0126 | 0.0416 | 0.000967 |
| JOGA-H2-4TR-100604 | JOGA-4TR | trail position #JOG4 hi-vol | 10/06/04 | 0.00198 | 0.00990 | 0.000990 |
| JOGA-H2-5TR-100604 | JOGA-5TR | trail position #JOG5 hi-vol | 10/06/04 | <0.00295 | 0.00296 | 0.000986 |
| JOGA-L2-1AD-100604 | JOGA-1AD | adult #1 | 10/06/04 | 0.00299 | 0.0180 | 0.000998 |
| JOGA-L2-2AD-100604 | JOGA-2AD | adult #2 | 10/06/04 | 0.0249 | 0.0588 | 0.000996 |
| JOGA-L2-3AD-100604 | JOGA-3AD | adult #3 | 10/06/04 | 0.0208 | 0.0367 | 0.000992 |
| JOGA-L2-4AD-100604 | JOGA-4AD | adult #4 | 10/06/04 | 0.0110 | 0.0280 | 0.000998 |
| JOGA-L2-5AD-100604 | JOGA-5AD | adult #5 | 10/06/04 | 0.0180 | 0.0319 | 0.000998 |
| JOGA-L2-1NA-100604 | JOGA-1NA | non-active adult | 10/06/04 | 0.0120 | 0.0240 | 0.00100 |
|
PCME fibers = fibers longer than 5 microns with a width between 0.25 and 3 microns, and an aspect ratio (length to width) greater than 3:1 AHERA-like total structures = structures longer than 0.5 microns with an aspect ratio greater than 3:1 (Note this differs somewhat from the strict AHERA structure definition) Sensitivity = the sample-specific lowest concentration of asbestos the laboratory can reliably detect s/cc = structures per cubic centimeter |
||||||
The entire length of the trail along which the START conducted the jogging/walking activity is shown and the positions of the stationary air sample pumps operating during Jogging/Walking Scenario B are shown as JOGB-1TR, JOGB-2TR/JOGB-12TR, JOGB-3TR, JOGB-4TR, and JOGB-5TR on Figure 5-17 (New York Creek Nature Trail Activity-Based Outdoor Air Sampling Locations–Jogging/Walking Scenarios). A summary of results for Jogging/Walking Scenario B samples is shown in Table 5-26 (New York Creek Nature Trail Jogging/Walking Scenario B Air Sample Summary Results). See Appendix B for a summary of the results from dust monitoring during this scenario.
| Region 9 NewsroomRegion 9 Programs | Grants & FundingUS-Mexico Border | Media CenterCareers | About Region 9A-Z Index |