Pacific Southwest, Region 9
Serving: Arizona, California, Hawaii, Nevada, Pacific Islands, Tribal Nations
Naturally Occurring Asbestos
El Dorado Hills
Multimedia Exposure Assessment
Preliminary Assessment and Site Inspection Report Interim Final
5.0 Summary of Investigative Efforts (cont'd)
5.4 Air Sampling
-
5.4.1 Ambient Outdoor Air Sampling
5.4.2 Activity-Based Air Sampling
- 5.4.2.1 Silva Valley Elementary School
- 5.4.2.2 Rolling Hills Middle School
- 5.4.2.3 Children's Playground at the Community Park
- 5.4.2.4 Playing Fields at the Community Park
- 5.4.2.5 New York Creek Nature Trail
- 5.4.2.6 Jackson Elementary School
5.4.2.3 Children’s Playground at the Community Park
The START conducted two scenarios at the Children’s Playground at the Community Park on October 4, 2004: a Typical Activity Scenario and an Aggressive Activity Scenario. The plan for these scenarios, as described in the El Dorado Hills Naturally Occurring Asbestos Multimedia Exposure Assessment, El Dorado Hills, California, Activity-Based Outdoor Air Sampling of Community Park Children’s Playground Field Sampling Plan, had called for members of the sampling team to simulate typical levels of children’s play activity during the Typical Activity Scenario and a slightly more vigorous level of activity during the Aggressive Activity Scenario. To limit the variables between the two scenarios, however, U.S. EPA directed members of the sampling team to simulate children’s play at about the same level of activity for both scenarios. The primary differences between the two scenarios were the addition of the following for the Aggressive Activity Scenario:
- A leaf blower was used just prior to conducting scenario activity on each side of the playground.
- Several box fans were set up in rings around each side of the playground to blow air toward the center of the playground during the scenario.
For both scenarios, the intakes for the air collection filter cassettes worn by the sampling team members were set at a height of about 3 feet. No stationary air sample pumps were operated during the either of the Children’s Playground scenarios.
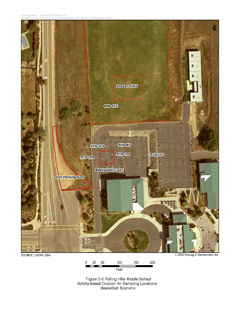
Figure 5-8
Rolling Hills Middle School Activity-Based Outdoor Air Sampling Locations B
Basketball Scenario
(Click image for larger version)

|
Table 5-11 Rolling Hills Middle School Basketball Scenario Air Sample Summary Results |
||||||
| Sample ID | Location | Location Description | Date | PCME Structures (s/cc) | AHERA-like Total Structures (s/cc) | Sensitivity (s/cc) |
| RHB-H2-1FD-100304 | RHB-1FD | on basketball court hi-vol | 10/03/04 | 0.000974 | 0.000974 | 0.000974 |
| RHB-H2-2FD-100304 | RHB-2FD | on basketball court hi-vol | 10/03/04 | 0.00297 | 0.00594 | 0.000990 |
| RHB-H2-3FD-100304 | RHB-3FD | on basketball court hi-vol | 10/03/04 | <0.00303 | 0.00203 | 0.00101 |
| RHB-H2-4FD-100304 | RHB-4FD | upwind hi-vol | 10/03/04 | <0.00286 | 0.00478 | 0.000957 |
| RHB-H2-5FD-100304 | RHB-5FD | far downwind hi-vol | 10/03/04 | <0.00293 | 0.000981 | 0.000981 |
| RHB-L2-1CH-100304 | RHB-1CH | child #1 | 10/03/04 | 0.00300 | 0.00900 | 0.000999 |
| RHB-L2-2CH-100304 | RHB-2CH | child #2 | 10/03/04 | 0.000995 | 0.00299 | 0.000995 |
| RHB-L2-3CH-100304 | RHB-3CH | child #3 | 10/03/04 | 0.000996 | 0.000996 | 0.000996 |
| RHB-L2-4CH-100304 | RHB-4CH | child #4 | 10/03/04 | 0.000989 | 0.00395 | 0.000989 |
| RHB-L2-14CH-100304 | RHB-4CH | duplicate of child #4 | 10/03/04 | 0.000991 | 0.00495 | 0.000991 |
| RHB-L2-5CH-100304 | RHB-5CH | child #5 | 10/03/04 | 0.000999 | 0.00400 | 0.000999 |
| RHB-L2-1NA-100304 | RHB-1NA | non-active adult | 10/03/04 | 0.00100 | 0.00502 | 0.00100 |
| CC2A-L6-1CA-100304 | adult #1 | composite sample collected during the 100304 scenarios | 10/03/04 | 0.000995 | 0.0109 | 0.000995 |
| CC2-L6-1CC-100304 | child #1 | composite sample collected during the 100304 scenarios | 10/03/04 | <0.00292 | 0.00195 | 0.000976 |
| CC2-L6-11CC-100304 | duplicate of child #1 | composite sample collected during the 100304 scenarios | 10/03/04 | 0.000982 | 0.00295 | 0.000982 |
| CC2-L6-2CC-100304 | child #2 | composite sample collected during the 100304 scenarios | 10/03/04 | <0.00298 | <0.00298 | 0.000996 |
| CC2-L6-3CC-100304 | child #3 | composite sample collected during the 100304 scenarios | 10/03/04 | 0.00393 | 0.0108 | 0.000982 |
| CC2-L6-4CC-100304 | child #4 | composite sample collected during the 100304 scenarios | 10/03/04 | 0.00300 | 0.0150 | 0.000999 |
| RHB-L2-1ZB-100304 | field blank | field blank | 10/03/04 | <0.00277 | <0.00277 | 0.000925 |
|
PCME fibers = fibers longer than 5 microns with a width between 0.25 and 3 microns, and an aspect ratio (length to width) greater than 3:1 AHERA-like total structures = structures longer than 0.5 microns with an aspect ratio greater than 3:1 (Note this differs somewhat from the strict AHERA structure definition) Sensitivity = the sample-specific lowest concentration of asbestos the laboratory can reliably detect s/cc = structures per cubic centimeter |
||||||
Typical Activity Scenario.
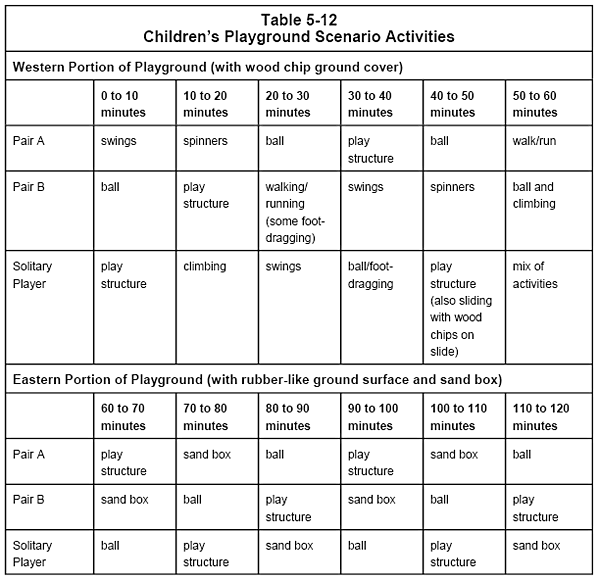
The START performed the Typical Activity Scenario first. The START conducted activity-based outdoor air sampling during the scenario according to the following scripted schedule (see Table 5-12: Children’s Playground Scenario Activities):
- For the first hour of the scenario five members of the sampling team simulated the activities of children playing in the western portion of the Children’s Playground, which has a wood chip ground cover. One member of the sampling team conducted solitary play activities during the scenario, while the other four sampling team members conducted activities in two pairs. They alternated activities every 10 minutes, as shown in Table 5-12 (Children’s Playground Scenario Activities).
- For the second hour of the scenario five members of the sampling team simulated the activities of children playing in the eastern portion of the Children’s Playground, which has rubberlike playground surface in most of the area and a sand box in one corner. One member of the sampling team continued to conduct solitary play activities during the scenario, while the other four sampling team members conducted activities in two pairs. They alternated activities every 10 minutes, as shown in Table 5-12 (Children’s Playground Scenario Activities).
Aggressive Activity Scenario. The START performed the Aggressive Activity Scenario second, with a break of more than an hour between the Typical Activity Scenario and the Aggressive Activity Scenario. The START conducted activity-based outdoor air sampling during the scenario according to the following scripted schedule:
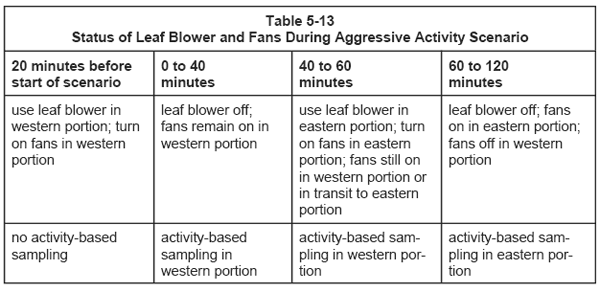
- For about 20 minutes prior to starting the scenario, one member of the sampling team used a leaf blower in the western portion of the Children’s Playground, which has a wood chip ground cover. The START placed several box fans in a ring around this portion of the playground facing the center of the area. The team member using the leaf blower turned on each of the fans as he walked around in that portion of the playground blowing toward the ground, at the play structures, and up toward the shade canopy. See Table 5-13: Status of Leaf Blower and Fans During Aggressive Activity Scenario.
- The leaf blower was turned off but the fans remained turned on, and for the first hour of the scenario five members of the sampling team simulated the activities of children playing in the western portion of the Children’s Playground. As was done during the Typical Activity Scenario, one member of the sampling team conducted solitary play activities during the scenario, while the other four sampling team members conducted activities in two pairs. They alternated activities every 10 minutes, as shown in Table 5-12 (Children’s Playground Scenario Activities).
- For about the last 20 minutes of the first hour, while the five members of the sampling team were still conducting scenario activities in the western portion of the Children's Playground, another member of the sampling team used a leaf blower in the eastern portion of the playground. This side of the playground has a rubber-like ground surface and a sand box. The START placed several other box fans in a circle around this portion of the playground, and the team member using the leaf blower turned on each of the fans as he walked around in that portion of the playground blowing toward the ground and at the play structures.
- The leaf blower was then turned off while the fans remained turned on, and for the second hour of the scenario five members of the sampling team simulated the activities of children playing in the eastern portion of the Children's Playground. One member of the sampling team continued to conduct solitary play activities during the scenario, while the other four sampling team members conducted activities in two pairs. They alternated activities every 10 minutes, as shown in Table 5-12 (Children's Playground Scenario Activities).
The outline of the Children’s Playground is shown on Figure 5-9 (Community Park Children’s Playground Activity-Based Outdoor Air Sampling Area–Typical and Aggressive Activity Scenarios). The position of the mobile meteorological station (which was used only during the Typical Activity Scenario) and the Ambient Air Monitoring Station are shown as TPG-MS and AAMS, respectively. The position of the mobile meteorological station is shown as RHB-MS. A summary of results for the playground scenario samples is shown in Table 5-14 (Community Park Children’s Playground Typical and Aggressive Activity Scenarios Air Sample Summary Results). See Appendix B for a summary of the results from dust monitoring during these scenarios.
| Region 9 NewsroomRegion 9 Programs | Grants & FundingUS-Mexico Border | Media CenterCareers | About Region 9A-Z Index |


