Tampa Bay Ecosystem Services
What you can learn from this page:
- Tampa Bay Area's Human Well-being Index Score
- Basic Concepts of the Human Well-being Index (HWBI)
- Community Personalization of HWBI through Stakeholder Ranking of What's Important to their Community
- Breakdown of Tampa Bay Area's HWBI by County and by Domain
- Where to Find More Information about HWBI
Basic Concepts of the Human Well-being Index
Ecosystems provide services to humans that support our well-being. Well-being is not only our health but also our quality of life. We rely upon the services provided by nature to help maintain good health and a high quality of life, including clean water, clean air, food and recreational opportunities. By protecting the environment, we are helping to sustain people's well-being. A holistic approach has been developed that provides a snap-shot characterization of people's well-being. The resulting Human Well-being Index (HWBI) is intended to be linked to ecosystem, economic and social services.
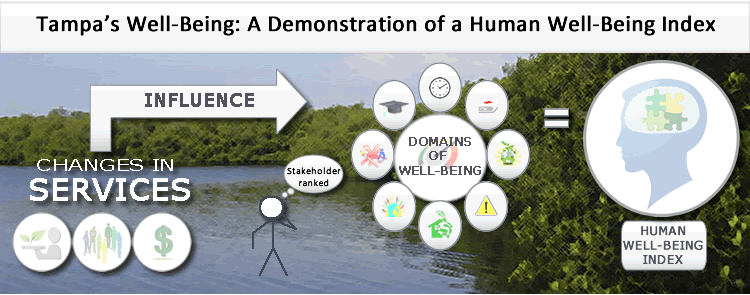
Individual and community well-being can be influenced by decisions made about environmental, economic, and social services. If decisions do not support stakeholder priorities, overall well-being in the community may greatly decline. The HWBI score for an area may change based on the relative importance of different components of well-being to stakeholders. The components of well-being, referred to as domains, include Connection to Nature, Cultural Fulfillment, Education, Health, Leisure time, Living Standards, Safety and Security, and Social Cohesion. The HWBI is a combination of the scores for each of the 8 domains. There are 25 indicators and 80 metrics that are used to calculate the domain scores. Different places may have different HWBI scores. Furthermore, those HWBI scores can change over time. HWBI scores are for spatial and temporal comparisons rather than qualitative judgment (good, fair, poor) based on absolute values of scores.
How Tampa Bay Area Stakeholders Influenced the HWBI Scores
Scores are unique to a population. Populations can be as large as a nation, or as small as a county.
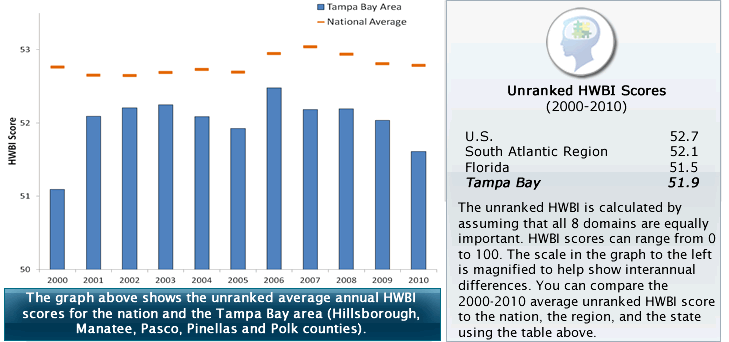
We can use the HWBI to track how community well-being is changing over time. HWBI may be lower in some years and higher in others, depending on specific events like a hurricane or economic recession.
HWBI may be also used to track how one community compares to other places.
For example, according to estimated HWBI scores the Tampa Bay area has slightly higher well-being than Florida as a whole, but slightly lower than the South Atlantic Region.
Each Domain of well-being is combined into an overall HWBI score.
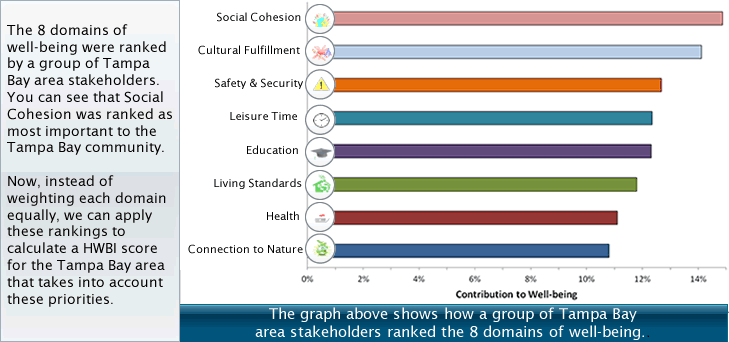
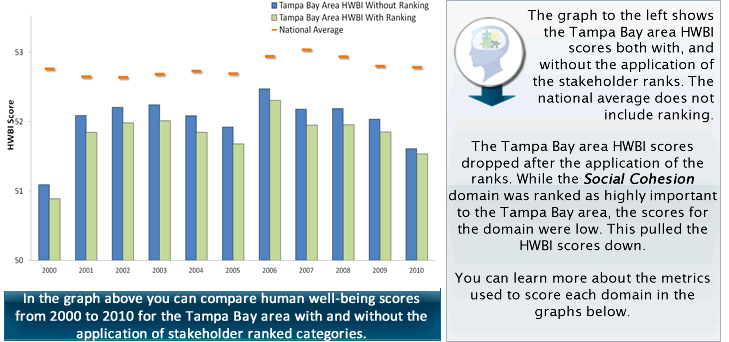
HWBI may be calculated by assuming all eight domains are equally important (without ranking) or personalized by working with stakeholders to rank what is important to their community.
Community personalization can influence overall HWBI scores, compared to calculation without ranking. For example, personalized HWBI may be lower if a domain perceived as very important has low scores.
Click the Links Below to Learn More about the Influence of Ranking
Note: The images associated with the links below will open up a new web page.
Breakdown of Tampa Bay Area's HWBI by County and by Domain
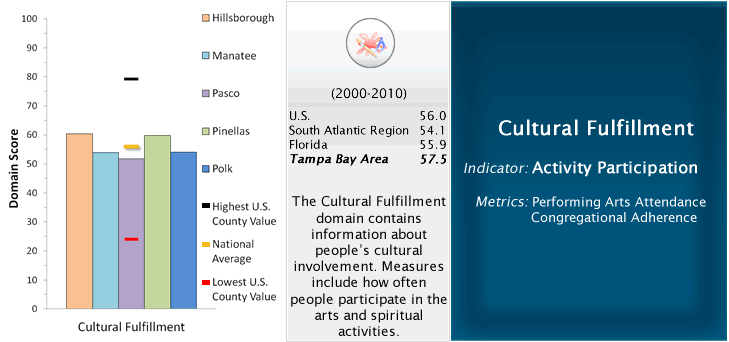
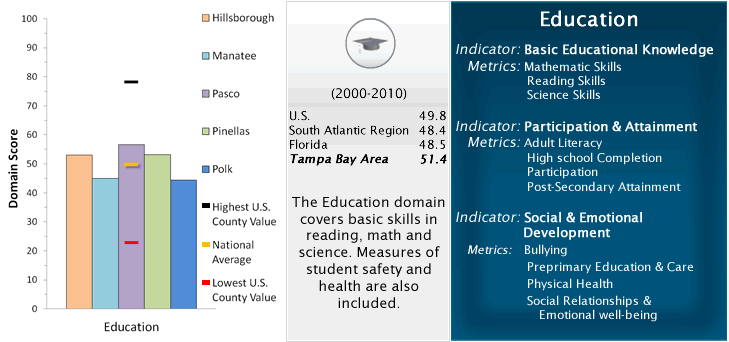
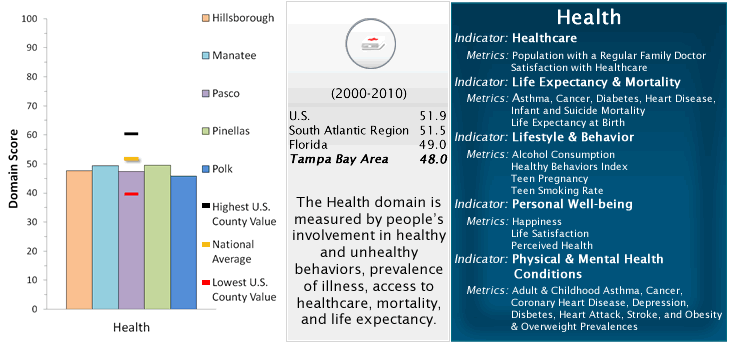
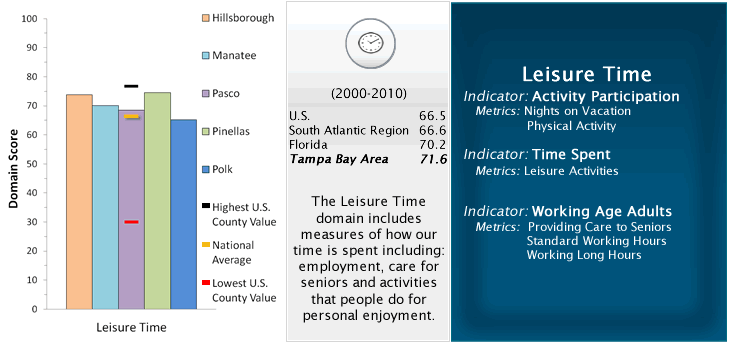
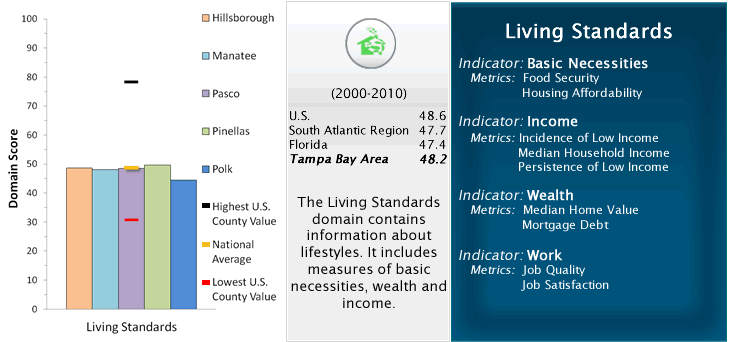
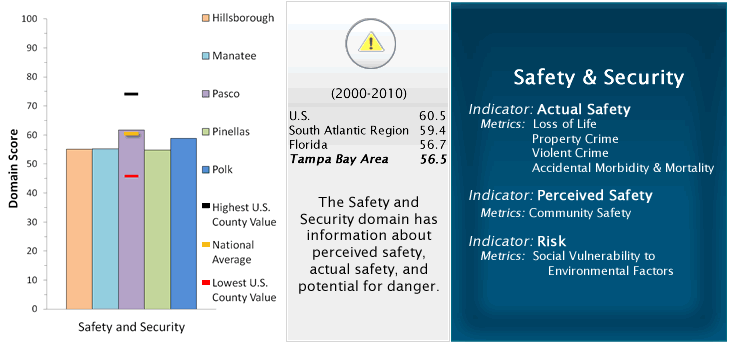
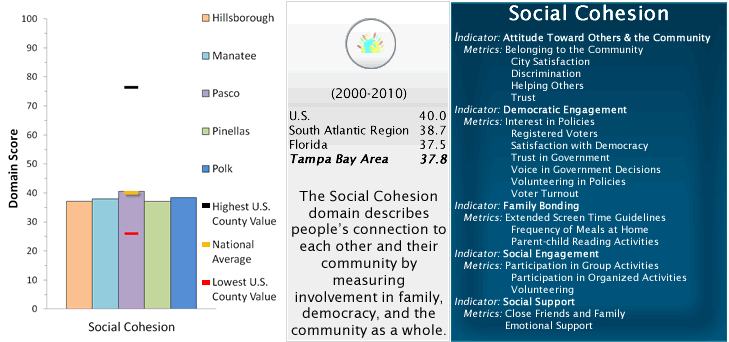
In the graph below you can see average (2000-2010) domain scores for each Tampa Bay Area county. The red line indicates the lowest U.S. county scores, the black indicates the highest U.S. county scores, and the orange line indicates that national average. Click on the domain icons to learn more about how Tampa Bay area counties compare to the state, region, and country as well as what measures were used to calculate the scores. We can now see that high scores in particular for Cultural Fulfillment and Education may be contributing to an overall higher HWBI score for the Tampa Bay Area, compared to Florida as a whole.
Click the Links Below to Learn More about the Domains of Well-Being
Note: The images associated with the links below will open up a new web page.
Now that you have learned about the HWBI and its application to Tampa, you may want to learn more about how this information can be used.
How can changes in the provisioning of ecosystem, economic and social services affect human well-being? Decision makers will be able to explore these relationships using a soon to be released tool. This tool will allow users to make adjustments to the levels of services provided and to see the potential change in the resulting HWBI score. This tool will support decision makers by providing informative scenarios backed by data and modeling. The conceptual relationships between the different services and categories of well-being may be explored in the Relational Browser.
More Information about HWBI
For more information about domains, please see:
Smith, L. M., J. L. Case, H. M. Smith, L. C. Harwell, and J. K. Summers. 2013. Relating ecosystem services to domains of human well-being: Foundation for a U.S. Index. Ecological Indicators 28:79-90
Go to the paper![]()
For more information about Relative Importance Values (RIVs), please see:
Smith, L. M., J. L. Case, L. C. Harwell, H. M. Smith, and J. K. Summers. 2013. Developing relative importance functions to model well-being: An example using ecosystem services. Human Ecology 41(4) Go to the paper![]()
For more information about how to calculate your community's Well-being Index, please see:
U.S. EPA. 2013. Indicators and Methods for Constructing a U.S. Human Well-being Index (HWBI) for Ecosystem Services Research. Report # EPA/600/R-12/023. pp. 114 Go to the report

