Hole-to-Hole Logging
Crosshole Seismic/Sonic Logging Survey
Basic Concept
Crosshole Sonic Logging (CSL) uses compressional seismic waves as the energy source. Seismic waves passing through concrete are influenced by the density and elastic modulus of the concrete. Fractured or "weak" concrete zones lower the velocity of the seismic waves and can, therefore, be detected. In addition, the amplitude of a seismic pulse is affected by these defects although this is not extensively used at the present time. The frequency content of the seismic energy pulse determines the resolution and penetration of the signal. High frequencies have high-amplitude attenuation but can image small targets. Conversely, lower frequencies have less attenuation but image larger targets. The seismic source produces an impulse whose frequency content is usually 30 to 40 kHz.
The CSL method is a "derivative" of the ultrasonic pulse velocity (UPV) test. The basic principle of the CSL test is that ultrasonic pulse velocity through concrete varies proportionally with the material density and elastic modulus. A known relationship between fractured or weak zones and measured pulse velocity and signal attenuation is fundamental for these tests. Research has shown that weak zones reduce velocities and increase attenuations. During the CSL measurements, the apparent signal travel time between transmitter and receiver are measured and recorded. By measuring the travel times of a pulse along a known distance (between transmitter and receiver), the velocity can be calculated as a function of distance over time. If a number of such measurements are made and compared at different points along the concrete structure, the overall integrity of the concrete can be assessed. The first-arrival travel times (FAT) recorded during CSL testing are known as compressional, primary, longitudinal, or P-wave arrivals. The P-wave is the wave having discrete particle motion in the same direction as the wave is moving. The surface of the constant phase, or the surface on which particles are moving together at a given moment in time, is called the wavefront. An imaginary line perpendicular to the wavefront is called a ray path. It is often assumed that a beam of produced ultrasonic energy travels along the ray path (Robert E. Sheriff and Lloyd P. Geldart, 1995). Basic elements of the emitted wave during CSL testing are presented in figure 1.
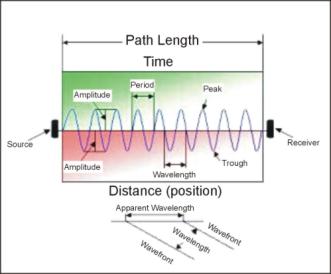
Figure 1. Basic wave elements.
The following are definitions of terminology used with CSL analyses (Robert E. Sheriff, 1978):
· wavelength (l) - distance between successive repetitions of a wavefront,
· amplitude (A) - maximum displacement from equilibrium,
· period (T) - time between successive repetitions of a wavefront,
· frequency (f) - number of waves per unit time,
· velocity (V) - speed at which a seismic wave travels, proportional to the frequency and wavelength (V=fl),
· apparent wavelength - distance between successive similar points on a wave measured at an angle to the wavefront,
· apparent velocity - product of frequency and apparent wavelength.
Velocity of the P-wave in homogenous "isotropic" media is related to the modulus and density of the medium through which the wave travels and is given as:
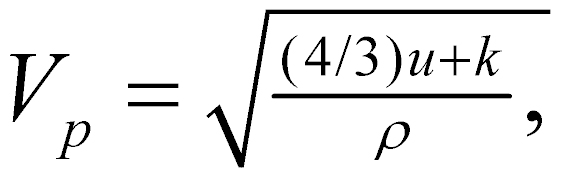 (1)
(1)
where
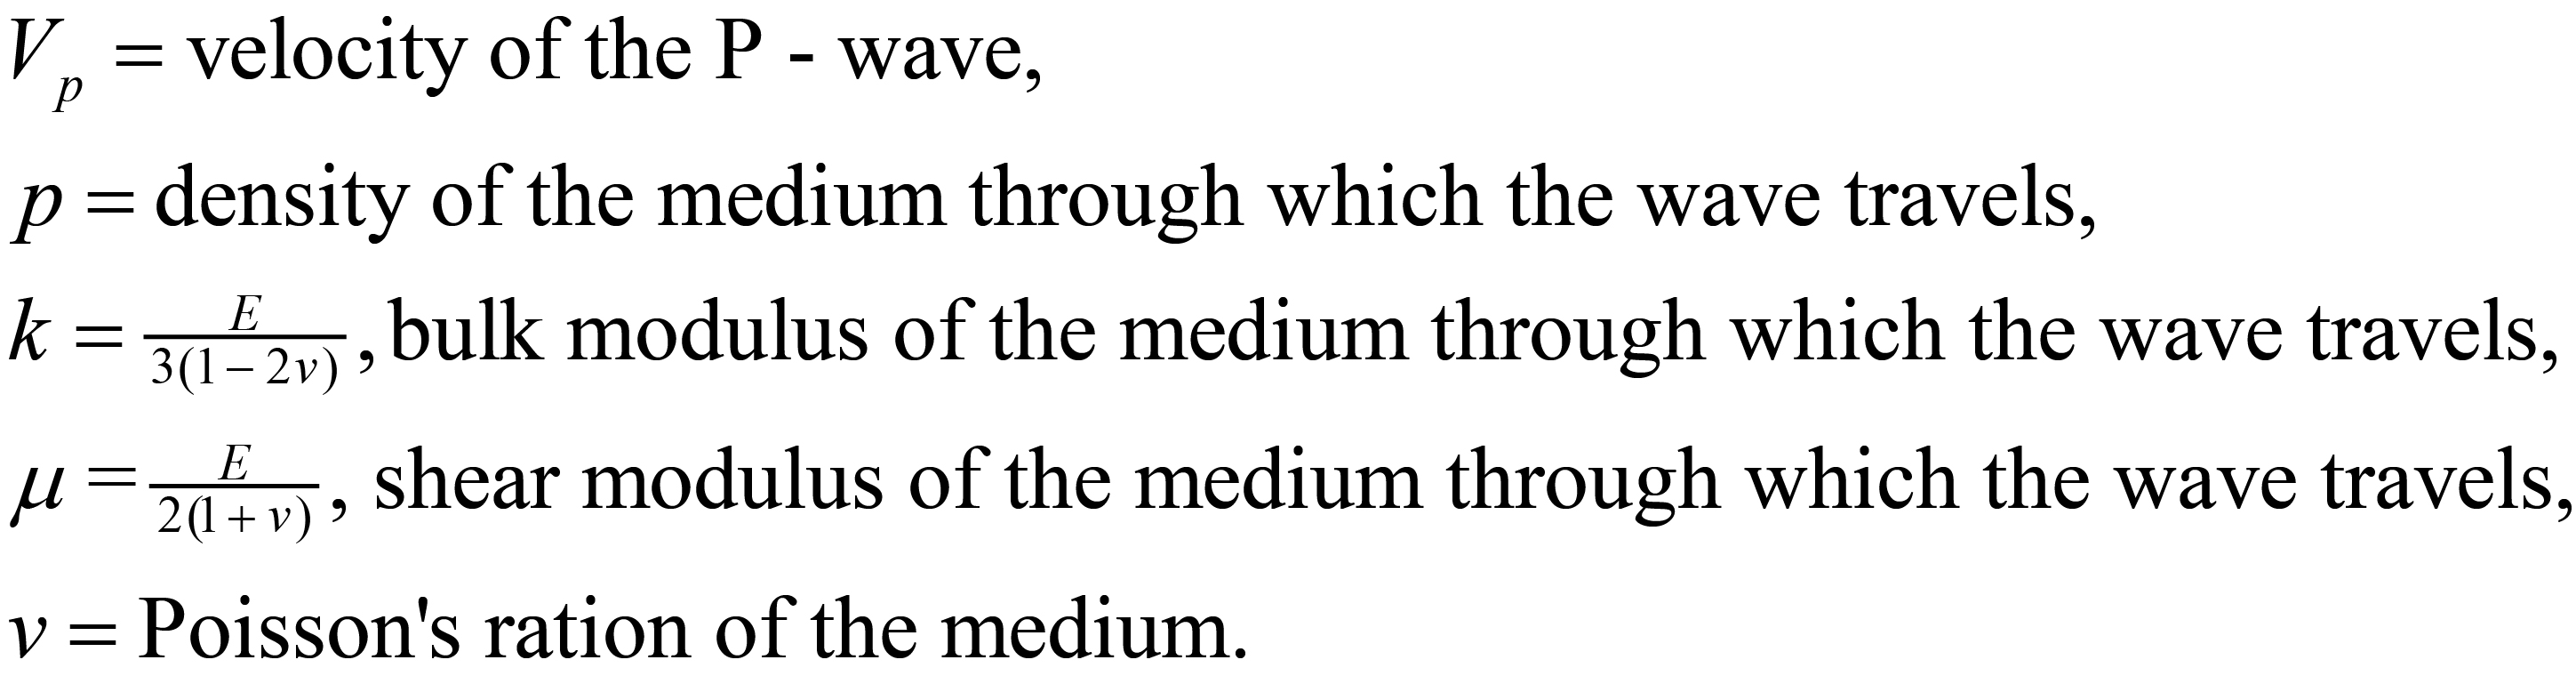
The P-wave velocity can then be written as:
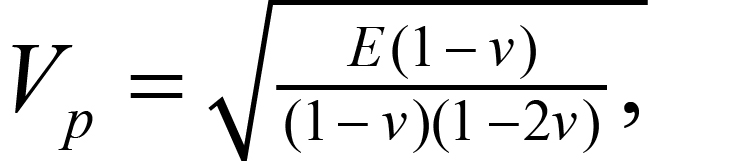 (2)
(2)
where
E=dynamic elastic modulus or Young's modulus
During CSL analysis, the first arrival times of the P-wave are picked using an automated picker within the CSL software, and the pulse velocity can be calculated as follows:
 (3)
(3)
For accurate results, it is recommended that the path lengths and transit times be measured with a precision greater than 1%. Although pulse velocity varies with different concrete mixes, the average pulse velocity of typical concrete is approximately 3,600 m/s. Knowing the linear distance between transmitter and receiver (path length), and the pulse transit time (first arrival time of the P-wave), the pulse velocity can then be calculated. If the CSL access tubes are not installed in a near-vertical position and/or the distance between them varies significantly along the length of the shaft, errors in velocity calculations may occur, and the results may be misleading.
The seismic wavelength can be calculated based on the known frequency of the transmitted signal and the calculated pulse velocity as shown in table 1.
Table 1 suggests that the higher the transmitted frequencies used during CSL testing, the shorter the wavelength, allowing for the detection of smaller defects. However, the tradeoff is that the higher the source signal frequency, the greater the signal absorption and the shorter the wavelength. This implies that if higher frequencies are used during the CSL testing, more accurate detection of small defects is permitted, but signal absorption will also be high, limiting the penetration range of the method. Frequencies in the range between 30 kHz and 40 kHz are commonly used for CSL tests.
Table 1. Numerical relationship between path length, transit time,frequency, period, velocity, and wavelength.
|
Path length, m |
Transit time, s |
Frequency, kHz |
Period (1/frequency), s |
Velocity (path length/ Transit time), m/s |
Wave length (velocity/ frequency), m |
|
0.6 m |
0.00016 s |
35 kHz |
0.000028 s |
3750 m/s |
0.1 m |
|
0.6 m |
0.00016 s |
50 kHz |
0.00002 s |
3750 m/s |
0.075 m |
|
0.6 m |
0.00024 s |
35 kHz |
0.000028 s |
2500 m/s |
0.071 m |
|
0.6 m |
0.00024 s |
50 kHz |
0.00002 s |
2500 m/s |
0.05 m |
The energy of an ultrasonic wave is a measure of the motion of the medium as the wave passes through it. Energy per unit volume is called energy density (Robert E. Sheriff and Lloyd P. Geldart, 1995). A wave passing through a medium possesses both kinetic and potential energy. Because the medium oscillates as the wave passes through it, energy is converted back and forth from kinetic to potential forms, but the total energy remains fixed. When the particle has zero displacement, the kinetic energy is maximum, and potential energy is zero. Conversely, when maximum displacement of the particle occurs, the kinetic energy is zero, and the total energy is all potential energy. When the total energy equals the maximum value of the kinetic energy, the energy density for a harmonic wave is proportional to the first power of the density of the medium and to the second power of the frequency and amplitude as shown in the following equation:
![]() (4)
(4)
where
E = total energy,
ρ = density,
f = transmitted frequency,
A = wave amplitude.
Data Acquisition
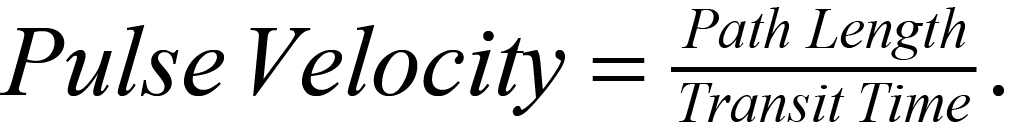
Figure 2 illustrates the CSL method. At least two drill holes, usually having a diameter of 50 mm, are required. The number of access tubes depends on the diameter of the shaft, and is shown in table 2.
Table 2. Required number of access tubes versus shaft diameter.
|
Shaft Diameter (D) |
Recommended Number of Tubes |
Tube Spacing, deg. |
|
D < 2.5ft (0.76 m) |
2 |
180 |
|
2.5 (0.76 m) < D < 3.5ft (1.07m) |
3 |
120 |
|
3.5 ft (1.07 m) < D < 5.0 ft (4.52 m) |
4 |
90 |
|
5.0 (1.52 m) < D < 8.0 ft (2.43 m) |
6 |
60 |
|
8.0 (2.43 m) < D |
8 |
45 |
For existing shafts, coreholes must be drilled to allow access for the CSL transmitter and receiver.
The access tubes are cased with either steel or schedule 40 PVC, and are securely tied to the rebar cage in a nearly vertical orientation before construction. Special care must be taken when installing access tubes to avoid debonding between the concrete and the tubes. Poor bonding between access tubes and concrete, or delamination, can cause complete signal loss. Since defects can also cause complete signal loss, poor bonding can be misinterpreted as a defect. The tubes must be filled with water before the survey is conducted. One of the tubes is used for the seismic transmitter and the other for the seismic receiver. These can be oriented such that the path between them is horizontal (zero offset, as seen in figure 4) or with some offset. Zero offset logging is called Crosshole Sonic Logging. Readings are taken at regular intervals down the shaft while maintaining the same offset. Defects are observed as a reduction in the travel time of the seismic wave from the transmitter to the receiver. It is important that the tubes are vertical and that the distance between them is constant for their entire length. If this is not the case, then the seismic travel time differences may result from these distance differences rather than defects in the concrete. In addition, unrecognized distance differences in the distance between tubes may result in false interpretations of defects.
Other variations in the geometric configuration are also used. These include the source and receiver lowered into the same tube, a source and multiple receivers lowered into separate holes, and a single source and single receiver lowered into adjacent holes, as described above. The most commonly used configuration is the later one.
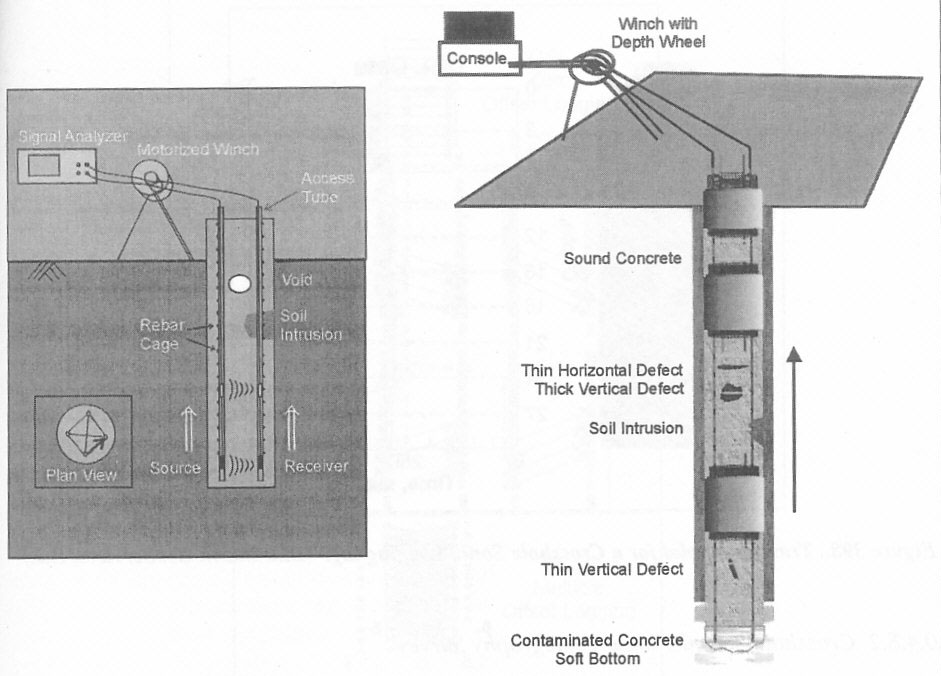
Figure 2. Crosshole Sonic Logging method with various kinds of defects/anomalies. (Blackhawk GeoServices)
Figure 2 shows the CSL method and the ray paths. Common defects are also shown, illustrating their influence on the seismic wave travel times.
Data Processing
The received data have to be plotted and presented such that any defects in the shaft are clearly observed. Figure 3 shows a typical CSL travel time plot. If only two access tubes are available and only one offset between the transmitter and receiver is used, then any anomalies may exist anywhere between the two tubes, and it is difficult to determine the geometry and exact location of the anomaly with respect to the tube location. However, if data are collected with several different offsets between the transmitter and receiver, then a more definitive location can be given for any anomalies.
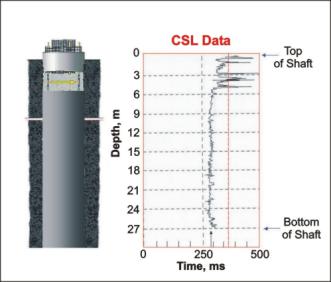
Figure 3. Travel time plot for a Crosshole Sonic Logging log. (Blackhawk GeoServices)
Crosshole Seismic/Sonic Tomography Survey
Basic Concept
If more drilled holes are available in the shaft, then CSL can be conducted using these holes, producing a better definition of the location of the defects. Recording readings from a number of offsets also helps to define the location of an anomaly. Data recording with two holes and a constant source-receiver offset is called CSL. If a number of offsets between the source and receiver are used, then tomographic calculations can be done and the method is called CSL Tomography (CSLT). The probes (source (S) and receiver (R)) are lowered to the bottom of a tube pair. Before the logging begins, one of the probes (e.g., the receiver) is lifted or lowered a specific offset distance (or angle) above or below the source level (respectively). Both probes are then pulled simultaneously up to maintain that offset distance. When the receiver is above the source, the records are defined as "positive" offset data. Conversely, when the receiver probe is lower than the source level, the records are defined as "negative" offset data. The offset, either positive or negative, is maintained during that logging run.
Use of multiple tubes and these multiple vertical offsets creates the ability to produce true 3-D tomographic images of an entire shaft. Figure 4 illustrates the different data recording geometries for CSL and CSLT. Tomographic calculations can also be done when more than one pair of holes is logged.
Figure 4. Ray paths for Crosshole Sonic Logging and Crosshole Sonic Logging Tomography; S-source, R-receiver. (Blackhawk GeoServices)
Figure 5 illustrates the results of a CSL survey compared to a CSLT survey. The two drawings on the left side of the figure show the ray paths for the CSL and CSLT systems. The third drawing shows the location of the defects in the shaft, and the fourth drawing illustrates the results of the CSL survey. As can be seen, the top and bottom of the defect are observed. However, it is not possible to identify the exact location of the source of the anomaly from the CSL data. However, with the CSLT data, it is possible to identify to a much greater extent, the location of the source of the anomaly.
Limitations
Probably the most important item is to make sure that the access tubes are vertical and bonded to the concrete. The seismic source must be capable of generating the high frequencies required to provide detailed images of any defects.
Currently this method cannot be used to image defects between the access tubes and the edge of the concrete shaft. However, research is currently being done to rectify this problem using CSLT.
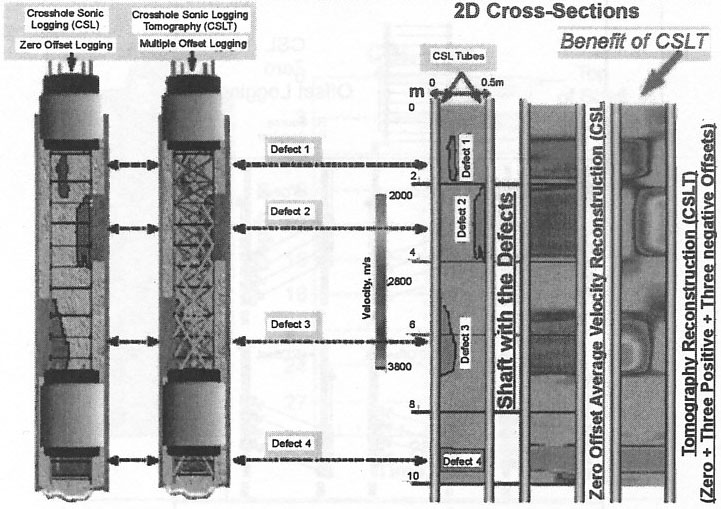
Figure 5. Comparison of Crosshole Sonic Logging and Crosshole Sonic Logging Tomography results (Blackhawk GeoServices).
The pages found under Surface Methods and Borehole Methods are substantially based on a report produced by the United States Department of Transportation:
Wightman, W. E., Jalinoos, F., Sirles, P., and Hanna, K. (2003). "Application of Geophysical Methods to Highway Related Problems." Federal Highway Administration, Central Federal Lands Highway Division, Lakewood, CO, Publication No. FHWA-IF-04-021, September 2003. http://www.cflhd.gov/resources/agm/![]()