Analyzing Generation and Management of Priority Chemicals 2005-2007: The National Priority Chemicals Trends Report
Note: EPA no longer updates this information, but it may be useful as a reference or resource.
Highlights
EPA's National Priority Chemicals Trends Report evaluates and analyzes the trends for quantities and management of the 31 Priority Chemicals (PCs) that industrial and federal government facilities reported to the Toxics Release Inventory (TRI) for reporting years 2005 through 2007 and are contained in hazardous waste streams reported for the Hazardous Waste Biennial Report (BR) for 2007.
TRI is a publicly available database with information on the use, release, and management of 581 individually listed chemicals and 30 chemical categories reported by industrial and federal facilities whose primary business activity is on the list of North American Industry Classification System (NAICS) codes subject to TRI reporting. PCs are chemicals that are persistent, highly toxic, and can accumulate in living organisms.
Data on hazardous waste generation and management activities are obtained from the Hazardous Waste Report (also called the Biennial Report). A BR must be submitted by large quantity generators (LQGs) and treatment, storage, and disposal facilities (TSDFs) every two years. In this Report, BR data (2005) for the seven PCs that are not reported to TRI are included.
The Trends Report is used for:
- showing progress toward achieving EPA's Government Performance Results Act (GPRA) national goal to reduce PCs in waste, and
- identifying opportunities to reduce these PCs, including assisting EPA in identifying potential partners for the National Partnership for Environmental Priorities (NPEP).
Tracking Progress Toward the GPRA Goal to Reduce PCs
We use this Report to show progress made in achieving EPA’s Government Performance and Results Act (GPRA) national goal to reduce PCs in wastes. By 2011, reduce 4 million pounds of priority chemicals from waste streams as measured by National Partnership for Environmental Priorities (NPEP) contributions, Supplemental Environmental Projects (SEPs), and other tools used by EPA to achieve priority chemical reductions. EPA has set additional goals to reduce 2 million pounds of priority chemicals in 2011 and 3 million pounds in 2012. We measure this goal through the achievements of National Partnership for Environmental Priorities (NPEP) partners.
| Priority Chemical | Reductions Achieved (pounds) | Total Reductions Achieved (pounds) FY 2007–2010 |
Percent of Total Reductions Achieved FY 2007–2010 | |||
|---|---|---|---|---|---|---|
| FY2007 | FY2008 | FY2009 | FY2010 | |||
| Lead and lead compounds | 553,831 |
3,845,767 |
6,849,711 |
1,708,793 |
12,958,102 |
81.8% |
| Naphthalene | 528,607 |
1,187,863 |
52,789 |
0 |
1,773,487 |
11.2% |
| Polycyclic aromatic compounds | 219,529 |
518,982 |
37,655 |
110,568 |
886,734 |
5.6% |
| Polychlorinated biphenyls | 4,600 |
5,671 |
96,089 |
359 |
106,719 |
0.7% |
| Dibenzofuran | 23,830 |
61,055 |
0 |
0 |
84,885 |
0.5% |
| Mercury and mercury compounds | 9,603 |
8,744 |
4,228 |
940 |
23,515 |
0.2% |
| Total | 1,340,000 |
5,628,082 |
7,040,472 |
1,820,660 |
15,833,442 |
100.0% |
Trends (Based on TRI data) in the Generation of Priority Chemicals
The Trends Report also provides information on and analyzes trends related to the quantities and management methods of PCs contained in RCRA Subtitle C hazardous wastes and non-hazardous RCRA Subtitle D industrial wastes for the nation, EPA Regions, states, counties, industry sectors, and federal facilities. We analyze PC trends based on the most recent three years of TRI data available: 2005-2007. This analysis assists EPA in assessing chemical reduction priorities and identifying opportunities for eliminating or reducing PCs.
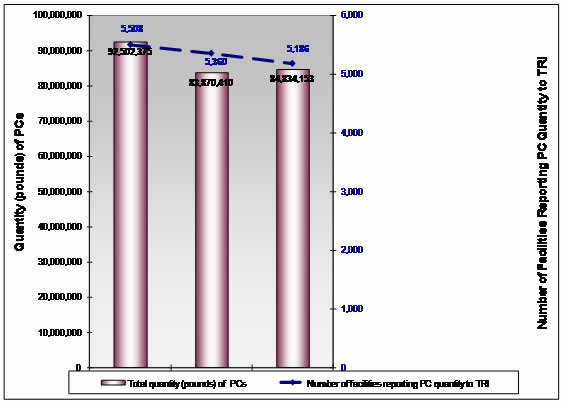
For 2007, facilities reported approximately 85 million pounds of PCs. Compared to the quantities reported in 2005 and 2006, this represents a decrease of almost 7.7 million pounds (- 8.3 %) and an increase of almost 1 million pounds (+ 1.1 %), respectively (see the table and graph below). The quantities of PCs generated each year are influenced by numerous factors, including:
- pollution prevention (e.g., waste minimization) measures
- changes in production levels
- process changes
- closure of facilities
- clean-up of spills/releases
- maintenance activities, e.g., clean-out of tanks and piping
| TRI Reporting Year | 2005 | 2006 | 2007 |
|---|---|---|---|
Total Quantity of PCs (pounds) |
92,502,375 |
83,870,410 |
84,834,153 |
Number of TRI Facilities Reporting PC Quantity |
5,508 |
5,360 |
5,186 |
Click the picture to view a larger image.
In 2007, four of the PCs (lead and lead compounds, naphthalene, hexachlor-1,3-butadiene and polycyclic aromatic compounds (PACs), accounted for approximately 79 percent of the total national quantity of PCs.
| Priority Chemical | Number of Facilities That Reported This PC in 2007 | Quantity (pounds) | Percent of National Total PC Quantity (2007) | Change in Quantity (2005–2007) | ||
|---|---|---|---|---|---|---|
| 2005 | 2006 | 2007 | ||||
| Lead and lead compounds | 4,413 |
36,789,827 |
36,538,601 |
34,467,769 |
40.6% |
-2,322,058 |
| Naphthalene | 644 |
17,232,309 |
14,143,706 |
12,071,587 |
14.2% |
-5,160,721 |
| Hexachloro-1,3-butadiene | 5 |
10,120,647 |
9,954,510 |
10,312,897 |
12.2% |
192,250 |
| Polycyclic aromatic compounds | 709 |
9,076,991 |
7,967,837 |
10,211,230 |
12.0% |
1,134,239 |
| Hexachlorobenzene | 25 |
6,685,476 |
4,549,984 |
6,524,018 |
7.7% |
-161,458 |
| Hexachloroethane | 9 |
6,095,933 |
4,166,250 |
5,487,132 |
6.5% |
-608,801 |
| Phenanthrene | 67 |
1,430,252 |
1,726,564 |
1,365,563 |
1.6% |
-64,689 |
| 1,2,4-trichlorobenzene | 10 |
1,269,422 |
1,372,426 |
1,342,738 |
1.6% |
73,316 |
| Benzo(g,h,i)perylene | 447 |
688,490 |
785,274 |
853,113 |
1.0% |
164,623 |
| Cadmium and cadmium compounds | 53 |
611,375 |
867,700 |
815,688 |
1.0% |
204,314 |
| Pentachlorobenzene | 6 |
545,884 |
550,242 |
599,016 |
0.7% |
53,132 |
| Pendimethalin | 8 |
558,624 |
291,521 |
202,417 |
0.2% |
-356,207 |
| Quintozene | 4 |
303,237 |
248,538 |
193,410 |
0.2% |
-109,827 |
| Anthracene | 43 |
601,973 |
379,752 |
154,336 |
0.2% |
-447,637 |
| Polychlorinated biphenyls (PCBs) | 37 |
143,479 |
108,559 |
90,203 |
0.1% |
-53,276 |
| Mercury and mercury compounds | 594 |
80,719 |
74,194 |
72,244 |
0.1% |
-8,475 |
| Trifluralin | 10 |
46,600 |
37,200 |
26,072 |
<0.1% |
-20,528 |
| Dibenzofuran | 13 |
139,463 |
89,871 |
22,308 |
<0.1% |
-117,155 |
| Pentachlorophenol | 19 |
77,281 |
14,814 |
21,960 |
<0.1% |
-55,322 |
| Dioxin and dioxin-like compounds* | 363 |
482 |
496 |
450 |
<0.1% |
-32 |
| 2,4,5-trichlorophenol | 0 |
3,800 |
2,255 |
0 |
0.0% |
-3,800 |
| Heptachlor | 0 |
109 |
69 |
0 |
0.0% |
-109 |
| Lindane | 0 |
0 |
0 |
0 |
0.0% |
0 |
| Methoxychlor | 0 |
0 |
45 |
0 |
0.0% |
0 |
Total |
92,502,375 |
83,870,410 |
84,834,153 |
100.0% |
-7,668,222 |
|
* Please note that numerous facilities reported more than one PC.
** Facilities report dioxin and dioxin-like compounds to TRI in grams, with a reporting threshold of 0.1 grams. For the purposes of this table, we converted the quantity reported as grams to pounds.
Trends in Management Methods for Priority Chemicals
The Trends Report presents an analysis of the trends seen in the management of PCs between 2005 and 2007. EPA and states use this information to identify potential waste minimization opportunities. See the following table for more information on the trends in PCs management from 2005-2007.
Some highlights concerning the overall methods that facilities used for the management of PCs:
Disposal
- In 2007, facilities used disposal for approximately 37.2 million pounds, or 44 percent, of non-recycled PCs; offsite disposal accounted for 74 percent of this quantity.
- Compared to the quantity of PCs disposed of in 2005, the quantity disposed of decreased by approximately 1.5 million pounds in 2006 and further decreased by approximately 1.7 million pounds in 2007. Offsite disposal deacreased significantly in both 2006 and 2007, by 3.1 million pounds and 1.4 million piunds, respectively.
- For the three metal PCs: cadmium, lead, and mercury (and their compounds) accounted for approximately 95 percent of the quantity disposed of. For non-metals, approximately 751,000 pounds of PACs and 718,000 pounds of naphthalene were land disposed in 2007, accounting for approximately 78 percent of the non-metal PC quantity disposed of.
Energy Recovery
- From 2005 to 2007, energy recovery accounted for an average of 11 million pounds or 13 percent of the non-recycled PC quantity generated, including approximately 10.5 million pounds or 12 percent in 2007. Onsite energy recovery accounted for approximately 87 percent of the total energy recovery.
- Two PCs: naphthalene (40.2%) and PACs (37.9%) accounted for approximately 78 percent of the total quantity of PCs burned for energy recovery in 2007.
Treatment
- In 2007, facilities treated approximately 37.2 million pounds, or 44 percent, of the quantity of non-recycled PCs generated; onsite treatment accounted for approximately 97 percent of the total quantity treated.
- Compared to the quantity of PCs treated in 2005, the quantity treated decreased by approximately 6.5 million pounds in 2006 but then increased by approximately 3.3 million pounds in 2007. Offsite treatment decreased by approximately 45 percent in 2007.
- Five PCs: hexachloro-1,3-butadiene (27.7%), naphthalene (19.2%), hexachlorobenzene (16.9%), PACs (14.8%), and hexachloroethane (14.0%) accounted for approximately 93 percent of the total quantity of PCs treated in 2007.
| Management Method | Quantity (pounds) | ||
|---|---|---|---|
| 2005 | 2006 | 2007 | |
| Onsite Disposal | 8,236,852 |
9,800,629 |
9,507,979 |
| Offsite Disposal | 32,200,180 |
29,115,976 |
27,686,934 |
Total Disposal |
40,437,033 |
38,916,605 |
37,194,912 |
| Onsite Energy Recovery | 6,459,739 |
7,383,337 |
9,086,085 |
| Offsite Energy Recovery | 5,196,773 |
3,671,768 |
1,366,848 |
Total Energy Recovery |
11,656,512 |
11,055,105 |
10,452,933 |
| Onsite Treatment | 38,822,398 |
32,094,340 |
36,201,122 |
| Offsite Treatment | 1,586,432 |
1,804,360 |
985,185 |
Total Treatment |
40,408,831 |
33,898,699 |
37,186,307 |
Total Non-Recycled PC Quantity |
92,502,375 |
83,870,410 |
84,834,153 |
The following table shows how each of the PCs was managed in 2007.
| Priority Chemical | Quantity (pounds) | ||||||
|---|---|---|---|---|---|---|---|
| Total PC Quantity | Disposal | Energy Recovery | Treatment | ||||
| Onsite | Offsite | Onsite | Offsite | Onsite | Offsite | ||
| Lead and lead compounds | 34,467,769 |
8,869,125 |
25,550,352 |
0 |
20 |
96 |
48,176 |
| Naphthalene | 12,071,587 |
13,283 |
704,489 |
3,217,225 |
983,439 |
6,721,153 |
431,999 |
| Hexachloro-1,3-butadiene | 10,312,897 |
2 |
10 |
0 |
19 |
10,284,530 |
28,336 |
| Polycyclic aromatic compounds (PACs) | 10,211,230 |
127,495 |
623,484 |
3,874,220 |
83,079 |
5,423,977 |
78,975 |
Hexachlorobenzene |
6,524,018
|
249
|
3,449
|
233,408
|
1,935
|
6,246,017
|
38,959
|
| Hexachloroethane | 5,487,132 |
74 |
0 |
279,739 |
17,186 |
4,999,666 |
190,468 |
| Phenanthrene | 1,365,563 |
2,311 |
134,799 |
1,002,410 |
37,315 |
163,156 |
25,571 |
| 1,2,4-trichlorobenzene | 1,342,738 |
3,700 |
3 |
107,930 |
18,038 |
1,199,724 |
13,343 |
| Benzo(g,h,i)perylene | 853,113 |
2,985 |
60,919 |
351,257 |
1,710 |
433,363 |
2,879 |
| Cadmium and cadmium compounds | 815,688 |
394,069 |
421,619 |
0 |
0 |
0 |
0 |
| Pentachlorobenzene | 599,016 |
11 |
0 |
3,240 |
0 |
594,572 |
1,193 |
| Pendimethalin | 202,417 |
81,371 |
1,181 |
0 |
0 |
100,140 |
19,725 |
| Quintozene | 193,410 |
0 |
2,357 |
0 |
189,215 |
0 |
1,838 |
| Anthracene | 154,336 |
398 |
104,992 |
16,656 |
20,004 |
10,102 |
2,184 |
| Polychlorinated biphenyls (PCBs) | 90,203 |
4,082 |
3,679 |
0 |
4 |
20,375 |
62,063 |
| Mercury and mercury compounds | 72,244 |
8,802 |
63,442 |
0 |
0 |
0 |
0 |
| Trifluralin | 26,072 |
8 |
177 |
0 |
0 |
1,900 |
23,986 |
| Dibenzofuran | 22,308 |
0 |
10,107 |
0 |
7,091 |
1,931 |
3,179 |
| Pentachlorophenol | 21,960 |
0 |
1,729 |
0 |
7,790 |
231 |
12,210 |
| Dioxin and dioxin-like compounds* | 450 |
13 |
144 |
0 |
3 |
190 |
100 |
| Total | 84,834,153 |
9,507,979 |
27,686,934 |
9,086,085 |
1,366,848 |
36,201,122 |
985,185 |
* Note: Facilities report dioxin and dioxin-like compounds to TRI in grams, with a reporting threshold of 0.1 grams. For the purposes of this table, we converted the quantity reported as grams to pounds.
Recycling of Priority Chemicals
Large quantities of some of the PCs are recycled. Recycled quantities were reported by facilities that only recycle PCs as well as by facilities that also manage their PCs using disposal, energy recovery, or treatment methods. In 2007, facilities recycled approximately 604 million pounds of PCs of which lead and lead compounds accounted for 92 percentEstimated Quantity of Priority Chemicals Contained in Hazardous Waste Streams (Based on 2007 BR Data)
We developed a methodology that estimates the quantity of PCs contained in BR waste streams that are reported under RCRA. The data derived from applying this methodology to the BR data supplements the data for the 24 PCs reported to TRI and also provides data for six of the seven PCs that are not reported to TRI. The focus of this methodology is primary generation activities that includes waste streams generated from a production process, service activity, or routine/periodic cleanup, where potential opportunities for direct waste minimization (e.g., source reduction, recycling) are the greatest. Based on applying this methodology to the 2007 BR data, we estimate that facilities reported hazardous wastes containing approximately 95 million pounds of PCs. Lead accounted for approximately 84 percent of the total quantity of PCs estimated to be contained in hazardous wastes.
| Priority Chemical | Number of Reporting Facilities | Estimated Quantity (pounds) of Priority Chemical Contained in BR Wastes (2007) |
Percent of Total Quantity |
||
|---|---|---|---|---|---|
| Wastewaters | Non-Wastewaters | Total Quantity | |||
| Lead | 5,627 |
1,649,271 |
78,357,135 |
80,006,407 |
84.5% |
| Mercury | 3,108 |
404,911 |
3,276,890 |
3,681,801 |
3.5% |
| Cadmium | 4,379 |
3,525 |
2,148,138 |
2,151,663 |
2.3% |
| Hexachlorobutadiene | 55 |
<1 |
1,633,334 |
1,633,308 |
1.8% |
| Hexachloroethane | 51 |
<1 |
1,313,364 |
1,313,330 |
1.4% |
| Hexachlorobenzene | 74 |
<1 |
1,282,864 |
1,282,834 |
1.4% |
| Naphthalene | 346 |
2,044 |
975,974 |
978,018 |
1.1% |
| Phenanthrene | 294 |
4,057 |
970,670 |
974,727 |
1.0% |
| Pentachlorobenzene | 23 |
0 |
943,921 |
943,921 |
1.0% |
| Pyrene | 272 |
14,296 |
353,917 |
368,212 |
0.4% |
| 1,2,4-Trichlorobenzene | 18 |
0 |
261,998 |
261,998 |
0.3% |
| Pentachlorophenol | 142 |
28,400 |
179,725 |
208,125 |
0.2% |
| 1,2,4,5-Tetrachlorobenzene | 24 |
0 |
171,048 |
171,048 |
0.2% |
| Anthracene | 214 |
2,822 |
152,928 |
155,750 |
0.2% |
| Benzo(a)anthracene* | 254 |
316 |
148,845 |
149,161 |
0.2% |
| Benzo(a)pyrene* | 264 |
220 |
119,725 |
119,945 |
0.1% |
| Fluorene | 189 |
238 |
106,983 |
107,221 |
0.1% |
| Acenaphthene | 211 |
1,922 |
90,362 |
92,284 |
0.1% |
| Indeno[1,2,3-cd]pyrene* | 146 |
2 |
53,473 |
53,475 |
0.1% |
| 7,12-Dimethylbenz(a)anthracene* | 50 |
0 |
35,924 |
35,924 |
<0.1% |
| Acenaphthylene | 9 |
0 |
34,921 |
34,921 |
<0.1% |
| Benzo(k)fluoranthene* | 139 |
18 |
24,189 |
24,207 |
<0.1% |
| Benzo(b)fluoranthene* | 146 |
18 |
24,179 |
24,197 |
<0.1% |
| Dibenzo(a,h)anthracene* | 147 |
20 |
21,701 |
21,721 |
<0.1% |
| Benzo(g,h,i)perylene | 100 |
2 |
5,187 |
5,189 |
<0.1% |
| 3-Methylcholanthrene* | 49 |
0 |
2,428 |
2,428 |
<0.1% |
| 2,4,5-Trichlorophenol | 123 |
6 |
40 |
46 |
<0.1% |
| Dibenzofuran | 102 |
9 |
2 |
11 |
<0.1% |
| Hexachlorocyclohexane, gamma- (Lindane) | 77 |
6 |
2 |
8 |
<0.1% |
| Methoxychlor | 39 |
0 |
1 |
1 |
<0.1% |
| Dioxins/Furans | 103 |
<1 |
<1 |
<1 |
<0.1% |
| Pentachloronitrobenzene (Quintozene) | 18 |
<1 |
<1 |
<1 |
<0.1% |
| 4-Bromophenyl phenyl ether | 5 |
0 |
<1 |
<1 |
<0.1% |
| Polychlorinated biphenyls (PCBs) | 1 |
0 |
<1
|
<1
|
<0.1%
|
| Heptachlor/Heptachlor epoxide | 22 |
<1 |
<1 |
<1 |
<0.1% |
| Endosulfan, alpha - and beta- | 15 |
<1 |
<1 |
<1 |
<0.1% |
Total |
2,112,103 |
92,689,777 |
94,801,881 |
100.0% |
|
Report Highlights: More Summary Information from the Trends Report
Use these links to view summary analyses without reading the entire Trends Report. Following these links, you will find links to the Trends Report itself.- Trends Report Frequent Questions
- Trends Report Highlights: Federal Facilities
- Trends Report Highlights: Industrial Sector Analysis
- Trends Report Highlights: Regional, State and Territory Analysis
- Trends Report Highlights: County Analysis
National Priority Chemicals Trends Report
You will need Adobe Reader to view some of the files on this page. See EPA's PDF page to learn more.
- Front Cover (PDF) (2 pp, 659K)
- Foreward (PDF) (2 pp, 45K)
- Customer Survey (PDF) (2 pp, 30K)
- Acronyms (PDF) (2 pp, 40K)
- Executive Summary (PDF) (3 pp, 55K)
- Table of Contents (PDF) (3 pp, 66K)
- Table of Exhibits (PDF) (5 pp, 98K)
- Section 1 (PDF) (7 pp, 85K) - Overview of the National PC Trends Report (2004-2006)
- Section 2 (PDF) (6 pp, 77K) - Progress Toward EPA’s Reduction Goal for Priority Chemicals (2004-2006)
- Section 3 (PDF) (24 pp, 345K) - Summary Trends Analyses for Priority Chemicals (2004-2006)
- Section 4 - Trends Analyses for Specific Priority Chemicals (2004 - 2006)
- Part 1 (PDF) (2 pp, 60K) - Introduction
- Part 2 (PDF) (6 pp, 88K) - Cadmium and Cadmium Compounds (Cadmium)
- Part 3 (PDF) (6 pp, 164K) - Dioxin and Dioxin-Like Compounds (Dioxin)
- Part 4 (PDF) (4 pp, 71K) - Hexachloro−1,3−butadiene (HCBD)
- Part 5 (PDF) (4 pp, 72K) - Hexachlorobenzene, HCB
- Part 6 (PDF) (4 pp, 79K) - Hexachloroethane (HCE)
- Part 7 (PDF) (10 pp, 228K) - Lead and Lead Compounds (Lead)
- Part 8 (PDF) (8 pp, 197K) - Mercury and Mercury Compounds (Mercury)
- Part 9 (PDF) (6 pp, 99K) - Naphthalene
- Part 10 (PDF) (6 pp, 89K) - Phenanthrene
- Part 11 (PDF) (7 pp, 101K) - Polycyclic Aromatic Compounds (PACs)
- Part 12 (PDF) (14 pp, 148K) - Priority Chemicals (PCs) Not Reportable to TRI
- Section 5 (PDF) (20 pp, 298K) - Federal Facility Trends for the Priority Chemicals (2004-2006)
- Section 6 (PDF) (26 pp, 277K) - Priority Chemical Analyses for Specific Industry Sectors
- Appendices A - F (PDF) - (23 pp, 251K)
- Back Cover (PDF) - (2 pp, 725K)
PC-BR and PC-TRI Methodologies
Use these links to view the methodology used to extract priority chemical data from the Biennial Hazardous Waste Report and the Toxics Release Inventory measurement methodology.
- PC-BR Methodology: Volume I (PDF) (192 pp, 2.2MB)
- PC-BR Methodology: Volume II (PDF) (168 pp, 3.4MB)
- PC-TRI Methodology (PDF) (58 pp, 981K)