MAIA Land-Use Change
and Resulting Ecological Vulnerability
Jackon, L.E. 1, S. L. Bird 2, R. W. Matheny 3, R. V. O'Neill 4, D. White 5, K. C. Boesch 6 and J. L. Koviach 7
This study explores ecological vulnerability to land-use change in the mid-Atlantic region by spatially extrapolating land and economic development, and overlaying these projections with maps of ecological indicators. As individual extrapolations have a high degree of uncertainty, five methods with different theoretical bases are employed. Confidence in projections is increased for counties targeted by two or more projection methods. This approach provides a comprehensive overview of potential regional development, leading to an objective prioritization of high-risk areas. The objective is to inform local planning and decision-making so that regional and cumulative ecological degradation are minimized.
1 U.S. EPA Office of Research and Development, National Health and Environmental Effects Research Laboratory, Research Triangle Park, NC
2 U.S. EPA Office of Research and Development, National Exposure Research Laboratory, Athens, GA
3 U.S. EPA Office of Research and Development, National Exposure Research Laboratory, Research Triangle Park, NC
4 Oak Ridge National Laboratory, Environmental Sciences Division, Oak Ridge, TN
5 U.S. EPA Office of Research and Development, National Health and Environmental Effects Research Laboratory, Corvallis, OR
6 Engelhardt, Hammer and Associates, Tampa, FL (analyses performed while at the University of North Carolina, Department of City and Regional Planning, Chapel Hill, NC)
7 University of North Carolina, Department of City and Regional Planning, Chapel Hill, NC
Maps used in support of this study are offered below. "Clicking" on any small map below will display an enlarged version of that particular map suitable for printing.
| Resource Economics Model | Urban Growth Model |
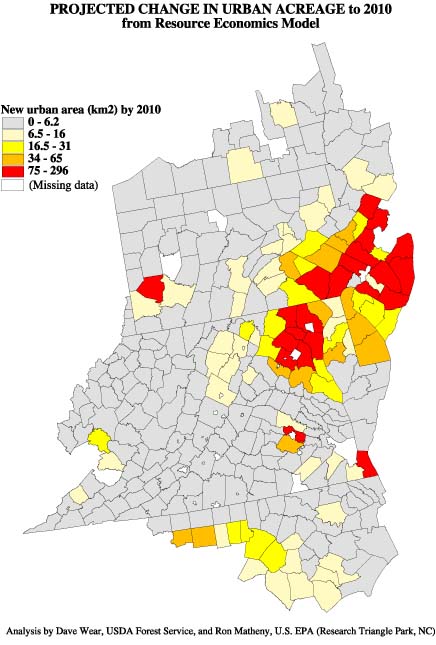 Analysis by David Wear, USDA Forest Service, and Ron Methany, U.S. EPA (Research Triangle Park, NC) Analysis by David Wear, USDA Forest Service, and Ron Methany, U.S. EPA (Research Triangle Park, NC) |
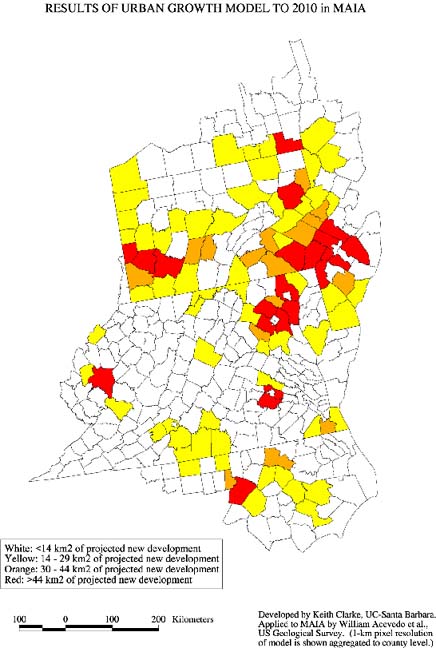 Developed by Keith Clarke, UC-Santa Barbara. Applied to MAIA by William Acevedo, et al., US Geological Survey. (1-km pixel resolution of model is shown aggregated to county level. Developed by Keith Clarke, UC-Santa Barbara. Applied to MAIA by William Acevedo, et al., US Geological Survey. (1-km pixel resolution of model is shown aggregated to county level. |
| Land Demand Model | Projected New Employment |
 Analysis by Sandy Bird, U.S. EPA (Athens, GA) Analysis by Sandy Bird, U.S. EPA (Athens, GA) |
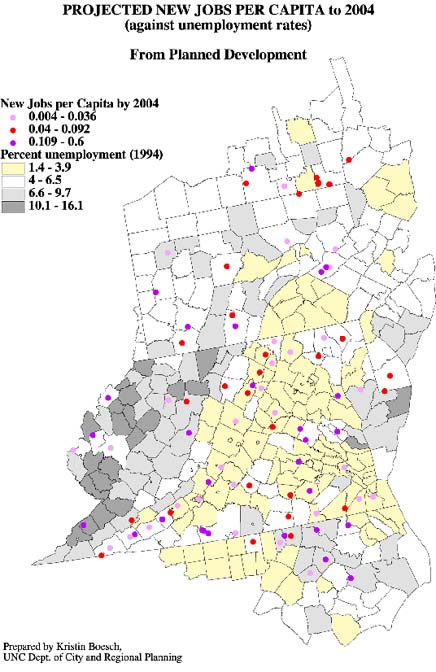 Prepared by Kristin Boesch, UNC Dept. of City and Regional Planning Prepared by Kristin Boesch, UNC Dept. of City and Regional Planning
|
| Planned Highway Construction | Contiguous Forest |
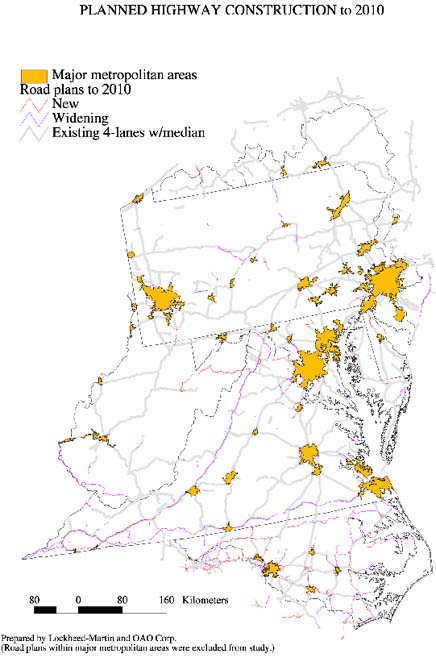 Prepared by Lockheed-Martin and OAO Corp. (Road plans within major metropolitan areas were excluded from study.) Prepared by Lockheed-Martin and OAO Corp. (Road plans within major metropolitan areas were excluded from study.)
|
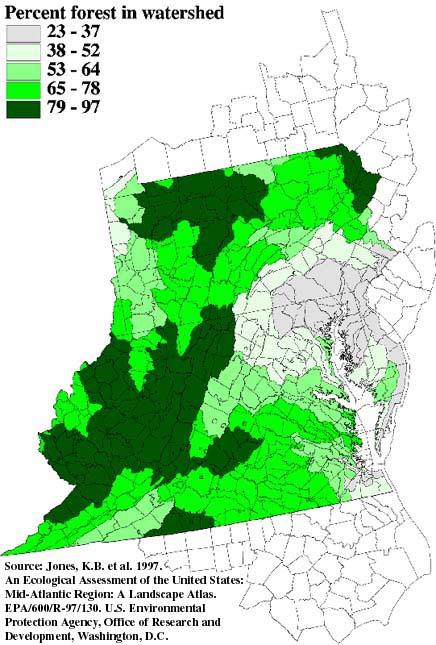 Source: Jones, K.B. et al. 1997. An Ecological Assessment of the United States: Mid-Atlantic Region: A Landscape Atlas. EPA/600/R-97/130. U.S. Environmental Protection Agency, Office of Research and Development, Washington, D.C. Source: Jones, K.B. et al. 1997. An Ecological Assessment of the United States: Mid-Atlantic Region: A Landscape Atlas. EPA/600/R-97/130. U.S. Environmental Protection Agency, Office of Research and Development, Washington, D.C. |
| Threatened & Endangered Species | Native Amphibian Species Richness |
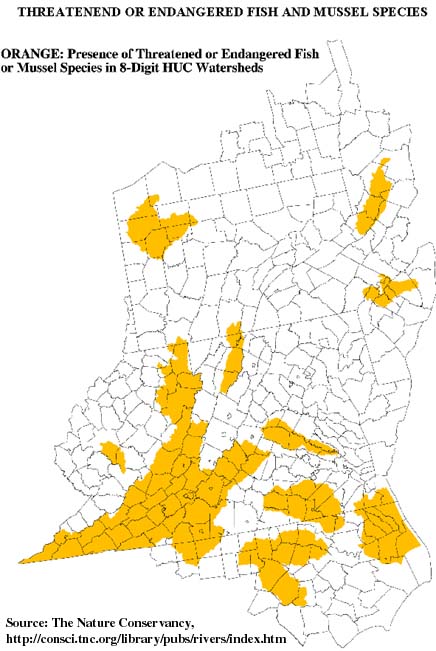 Source: The Nature Conservancy Source: The Nature Conservancy  |
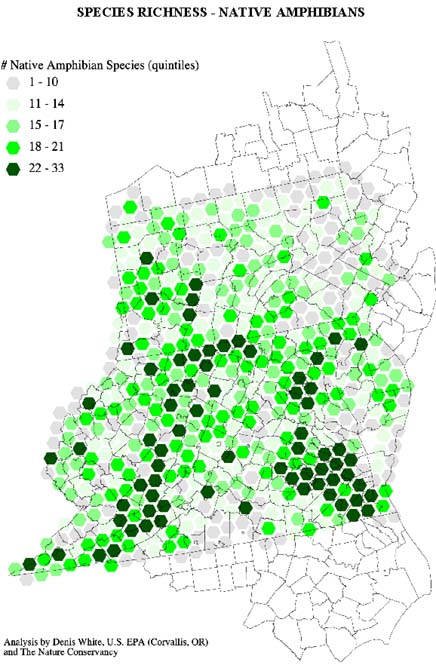 Analysis by Denis White, U.S. EPA, (Corvalis OR) and The Nature Conservancy Analysis by Denis White, U.S. EPA, (Corvalis OR) and The Nature Conservancy |
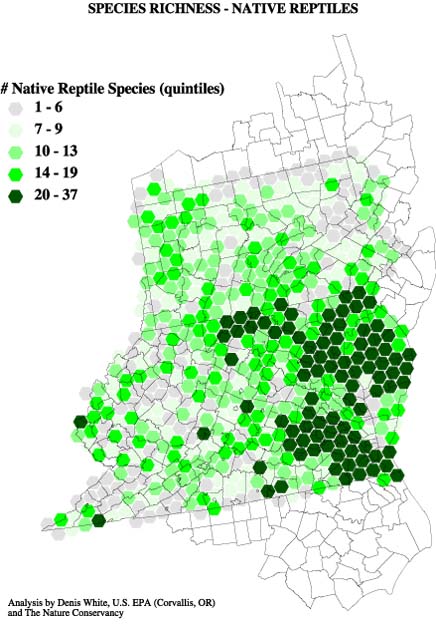
| Native Fish Species Richness | Native Reptile Species Richness |
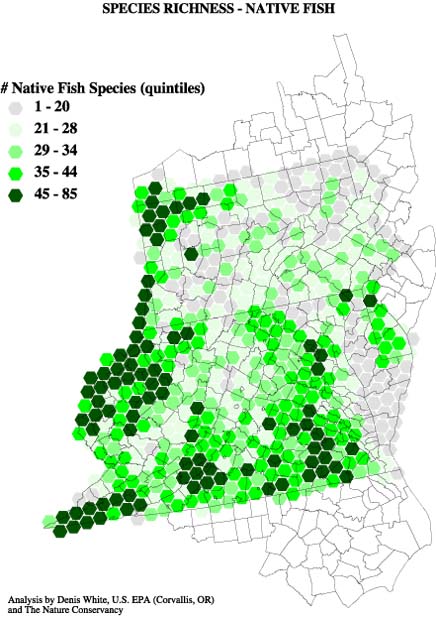 Analysis by Denis White, U.S. EPA, (Corvalis OR) and The Nature Conservancy Analysis by Denis White, U.S. EPA, (Corvalis OR) and The Nature Conservancy |
 Analysis by Denis White, U.S. EPA, (Corvalis OR) and The Nature Conservancy Analysis by Denis White, U.S. EPA, (Corvalis OR) and The Nature Conservancy |
| Non-Indigenous Bird Species Richness | Non-Indigenous Fish Species Richness |
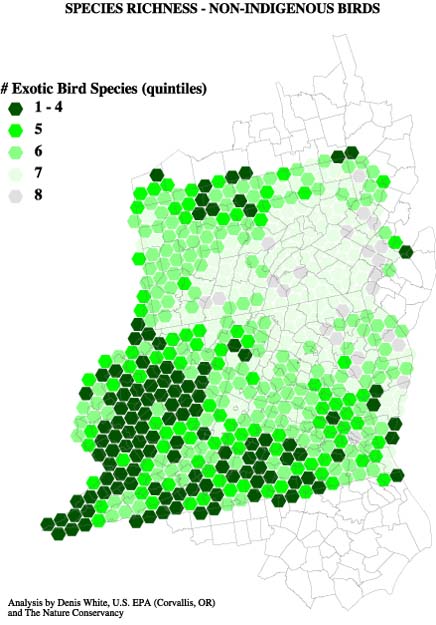 Analysis by Denis White, U.S. EPA, (Corvalis OR) and The Nature Conservancy Analysis by Denis White, U.S. EPA, (Corvalis OR) and The Nature Conservancy |
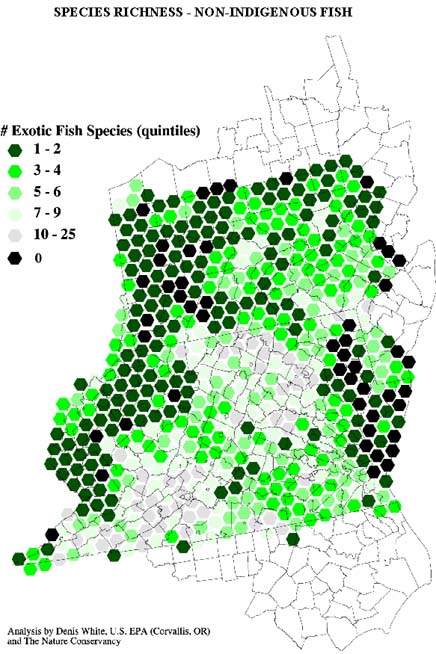 Analysis by Denis White, U.S. EPA, (Corvalis OR) and The Nature Conservancy Analysis by Denis White, U.S. EPA, (Corvalis OR) and The Nature Conservancy |