Results of the National REI Study
The US Recycling Economic Information Study proves that “Recycling is Working” by measuring the size of the nation’s reuse and recycling industry. Below are a few of the key findings of this groundbreaking study.
You will need Adobe Reader to view some of the files on this page. See EPA’s PDF page to learn more.
- Full REI Report (PDF) (158 pp, 2.9MB)
This 158-page report details the comprehensive REI analysis. - REI Executive Summary (PDF) (11 pp, 125K)
This 11-page report provides an overview of the full REI report.
Key Findings
- Recycling and Reuse Add Value to the US Economy
According to the study, the recycling and reuse industry consists of approximately 56,000 establishments that employ more than 1.1 million people, generate an annual payroll of nearly $37 billion, and gross over $236 billion in annual revenues. This represents a significant force in the US economy and makes a vital contribution to job creation and economic development.
Estimates of Direct Economic Activity
Annual Payroll and Estimated Receipts are in $1,000. Throughput is in
Thousands of Tons.
| Data Type | Recycling Collection | Recycling Processing | Recycling Manufacturing | Reuse and Remanufacturing | Industry Total |
|---|---|---|---|---|---|
| Establishments | 9,247 | 12,051 | 8,047 | 26,716 | 56,061 |
| Employment | 32,010 | 160,865 | 759,746 | 169,183 | 1,121,804 |
| Annual Payroll | 956,875 | 3,826,360 | 29,181,749 | 2,747,498 | 36,712,482 |
| Estimated Receipts | 1,974,516 | 41,753,902 | 178,390,423 | 14,182,531 | 236,301,371 |
| Estimated Throughput1 | 191,082 | 191,082 | 157,545 | N/A | N/A |
1 Throughput is amount of recovered material recycled and includes manufacturing scrap sent for recycling. It excludes materials prepared for fuel use and in-house process scrap returned to the manufacturing process. Throughput estimates are summed to avoid triple counting at collection, processing, and manufacturing stages.
Top of Page | Back to Recycling is Working
- Recycling is Competitive with Other Major Industries
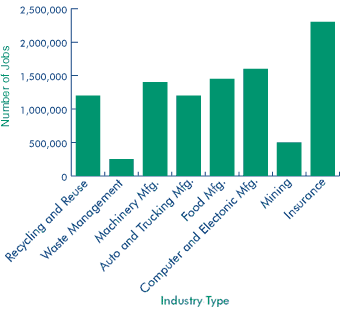
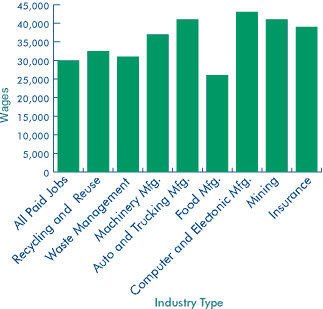
As a driver of economic activity, the recycling industry compares favorably to other key industries, such as automobile manufacturing and mining. Especially significant is the finding that recycling far outpaces the waste management industry because recycling adds value to materials, contributing to a growing labor force. Recycling also provides a large number of jobs that generally pay above the average national wage.
Top of Page | Back to Recycling is Working
- Local Recycling and Reuse Spur “Downstream” Economic Impacts
Investment in local recycling collection and processing, as well as strong government policies, spurs significant private sector investment in recycling manufacturing and promotes economic growth. The study tallied this “indirect” impact of recycling on support industries, such as accounting firms and office supply companies, for a total of 1.4 million jobs supported by the recycling and reuse industry. These jobs have a payroll of $52 billion and produce $173 billion in receipts.Spending by employees of the recycling and reuse industry also contributes indirectly and adds another 1.5 million jobs with a payroll of $41 billion and produces receipts of $146 billion. The recycling and reuse industry also generated roughly $12.9 billion in federal, state, and local tax revenues, with 80 percent going to federal and state government.
Contribution of Recycling and Reuse to Government Revenues – Direct Effects Revenues
(in $ millions)
| Industry Sector | Federal | State | Local | Total |
|---|---|---|---|---|
| Recycling Collection | 200 | 100 | 100 | 400 |
| Recycling Processing | 700 | 400 | 300 | 1,400 |
| Recycling Manufacturing | 5,400 | 2,600 | 2,100 | 10,000 |
| Reuse/Remanufacturing | 600 | 300 | 200 | 1,200 | Total | 6,900 | 3,400 | 2,600 | 12,900 |
| Industry Sector | Federal | State | Local | Total |
|---|---|---|---|---|
| Recycling Collection | 300 | 200 | 100 | 600 |
| Recycling Processing | 1,700 | 800 | 600 | 3,200 |
| Recycling Manufacturing | 20,500 | 9,900 | 7,800 | 38,200 |
| Reuse/Remanufacturing | 2,100 | 1,000 | 800 | 3,900 |
| Total | 24,600 | 11,900 | 9,400 | 45,800 |
Top of Page | Back to Recycling is Working
- Recycling is a Diverse Industry
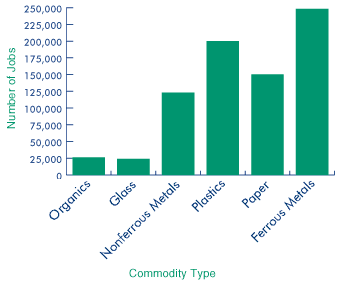
The study identified 26 different types of recycling organizations, some of which might not commonly be seen as “recycling” businesses, such as steel mills, plastic bottle manufacturers, and pavement producers. Recycling is an integrated system that starts with curbside collection of materials by municipalities, involves processing of recycled materials, and leads to manufacturing of new products with recycled content.Four major manufacturing industries account for over half of the economic activity of the recycling and reuse industry: paper mills, steel mills, plastics converters, and iron and steel foundries. But the recycling industry also includes companies that are quickly finding a market niche, including computer demanufacturing, organics composters, and plastic lumber manufacturers.
Recycling Manufacturing Industry Employment by
Major Material Group

Top of Page | Back to Recycling is Working
- Reuse
Businesses Contribute Significantly. The reuse industry is widespread and ranges from more traditional establishments such as local thrift stores and antique shops to more recent, dynamic operations such as computer demanufacturers, pallet rebuilders, and materials exchanges. As a whole, the reuse industry employs nearly 170,000 workers in more than 26,000 establishments nationwide. The reuse industry also supports an annual payroll of $2.7 billion and generates revenues of approximately $14.1 billion.
Analysis of Economic Activity for the Reuse Industry Establishments 26,716 Employment 169,183 Annual Payroll $2,747,498,000 Estimated Revenue $14,182,531,000
![[logo] US EPA](../gif/logo_epaseal.gif)

