Assessing Outdoor Air Near Schools
South Allegheny Middle/High School - McKeesport, PA
- Understanding the Monitoring Data
- Initial Sample Results
- Initial Analysis
- Additional Sample Results
- Final Analysis
Results and Analysis of EPA’s Additional Monitoring
EPA selected this school for monitoring because it is located near a large coke oven and coke by-product facility, as well as other industries which are sources of air toxics emissions. Air monitoring was initially conducted at both Clairton Educational Center from September 4, 2009 to December 21, 2009 and at South Allegheny Middle/High School from August 5, 2009 to November 30, 2009 to assess concentrations of benzene and other volatile organic compounds (VOCs); arsenic and other metals in particulate matter less than 10 microns (PM10); and benzo(a)pyrene and other polycyclic aromatic hydrocarbons (PAHs) in the air. EPA extended air toxics monitoring at South Allegheny Middle/High School to better characterize exposure to that community from the nearby coke oven and the coke by-product facilities. At Clairton, levels of pollutants were below the levels of significant concern. This information from the 2009 monitoring is provided in the first report (PDF) (47pp, 786k). Additional monitoring for benzene and other VOCs, arsenic and other metals, and benzo(a)pyrene and other PAHs were conducted at South Allegheny Middle/High School from August 19, 2011 to April 3, 2012.
| Primary Findings | The levels of benzene, arsenic, and benzo(a)pyrene measured in the outdoor air over this nine month period continue to indicate the influence of nearby sources. The concentrations of these key pollutants plus others, and the associated longer-term concentration estimates indicate the potential for the mixture of pollutants in the air to pose concerns for long-term continuous exposures. |
| Key Pollutants Monitored | Benzene. Inhalation of benzene at high levels can affect the bone marrow and can cause anemia and leukemia. |
| Next Steps | Based on the analysis described here, EPA will not extend air toxics monitoring at this location. The Allegheny County Health Department (ACHD) has worked with these sources to reduce their emissions. EPA remains concerned about emissions from sources of air toxics and continues to work to reduce those emissions across the country, through national rules and by providing information and suggestions to assist with reductions in local areas. The Allegheny County Health Department (ACHD) will continue to oversee industrial facilities in the area through air permits and other programs. ACHD has been collecting monitoring data for a variety of pollutants at South Allegheny Middle/High School since October 4, 1969. Additional air monitors that measure particulates in the same area are located at Glassport, Lincoln and Clairton air monitoring stations. These stations as well as the S. Allegheny station will continue to be operated as part of the ACHD’s routine air monitoring network. |
Summary of Study Approach and Findings
Approach:
- A monitor collected air samples from August 19, 2011 through April 3, 2012 at South Allegheny Middle/High School in McKeesport, PA.
- Individual air sample results are posted on this website.
- When the monitoring was complete, we analyzed the results to see if there was a concern from long-term concentrations (over a lifetime).
- Also, when the monitoring was complete, we evaluated all the air samples from the on-site monitor. We also evaluated information on wind speed and wind direction from a weather monitor at the school, along with historical weather information and information about nearby sources of benzene, arsenic, and benzo(a)pyrene emissions.
Findings:
- Measured values of benzene, arsenic (PM10), benzo(a)pyrene, and other monitored pollutants indicate an influence of the source at this school.
- The process to identify schools for monitoring relied on emissions estimates and other information. Ambient air monitoring at the school allowed measurement of what was actually in the air.
- The nearby sources influencing the air quality at the school have recently taken actions to control air emissions. The facilities will continue control equipment upgrades to meet the PM2.5 SIP that requires compliance with PM2.5 NAAQS within 5 years of approval. One facility has invested nearly $500 million to upgrade older polluting equipment with newer cleaner equipment. In addition, the same facility has applied for government grants to install new, updated quench towers to control particulate pollution. Another nearby contributing facility has installed a new thermal oxidizer that is expected to reduce naphthalene emissions by nearly 68%. These recent upgrades are expected to further reduce the air pollution from the contributing facilities. In addition, the contributing coal burning EGU upwind of the school has recently shut down and is no longer in operation. Emissions from the power plant are no longer impacting S. Allegheny and the surrounding area.
- Based on these findings, EPA will not extend air toxics monitoring at the South Allegheny Middle/High School.
- Click here for additional information
How We Analyzed the Information We Collected at these Schools
The analysis considered whether the information collected at these schools might raise concerns for the health of children or adults at these schools. We looked at the following types of information:
- Measured benzene, arsenic, and benzo(a)pyreneconcentrations and information on benzene, arsenic, and benzo(a)pyrene
- Measured wind direction and wind speed at these schools
- Information about nearby sources of benzene, arsenic, and benzo(a)pyrene emissions
Analysis of Measured Concentrations:
At South Allegheny Middle/High School, benzene, arsenic (PM10), benzo(a)pyrene, and other monitored pollutants indicate an influence of the sources at this school. The complete analyses of these data indicate the potential for levels of concern for long-term, continuous exposure to benzene individually, and to the mixture of these pollutants in areas of this neighborhood.
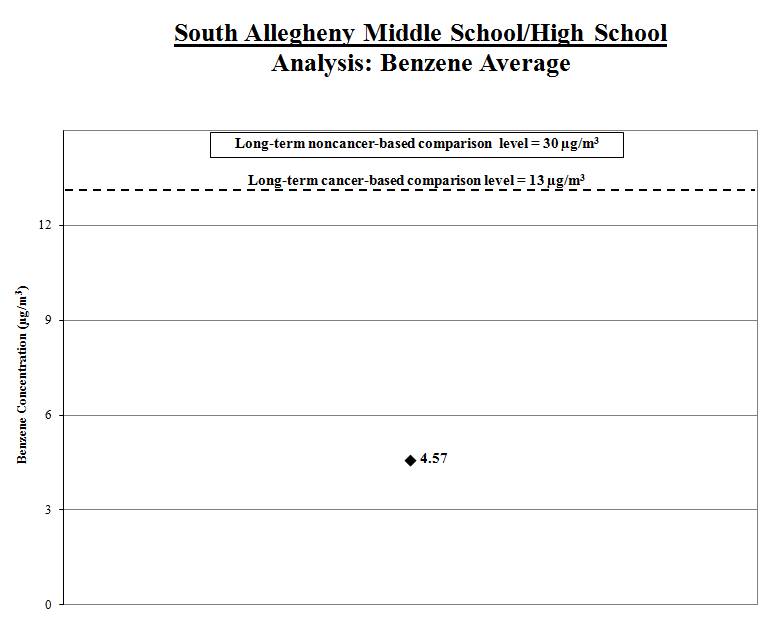
1a. Calculate the benzene average: We calculated the averages of the benzene measurements (shown by the black diamond in the graph below). We compared these averages to the long-term comparison levels (see thick line on the graph below).
Result: The average benzene levels for the samples collected at South Allegheny Middle/High School were below the long-term comparison levels.
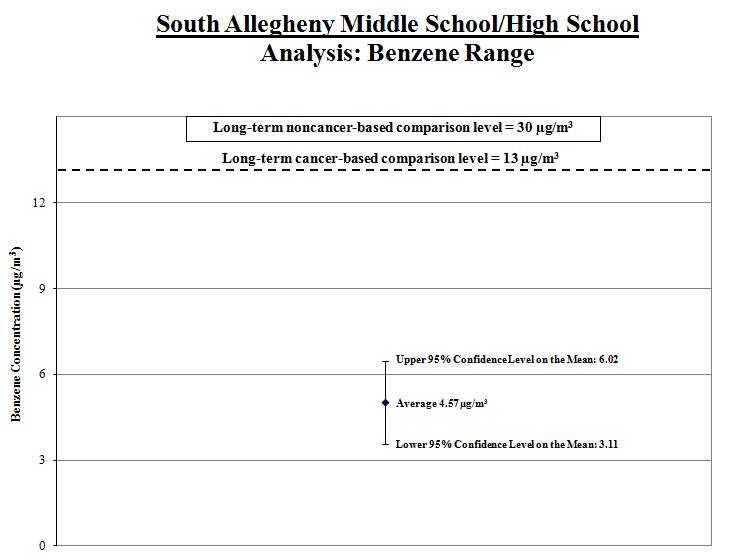
1b. Calculate a range for the benzene average: To account for varying air concentrations of benzene, we calculated ranges around the averages. We did this by estimating high and low values that the longer-term concentrations might reach using common statistical tools. We compared the highest points in the ranges (called the “upper bounds”) to the long-term comparison levels.
Result: The high ends of the ranges for the samples collected at South Allegheny Middle/High School are lower than the comparison levels.
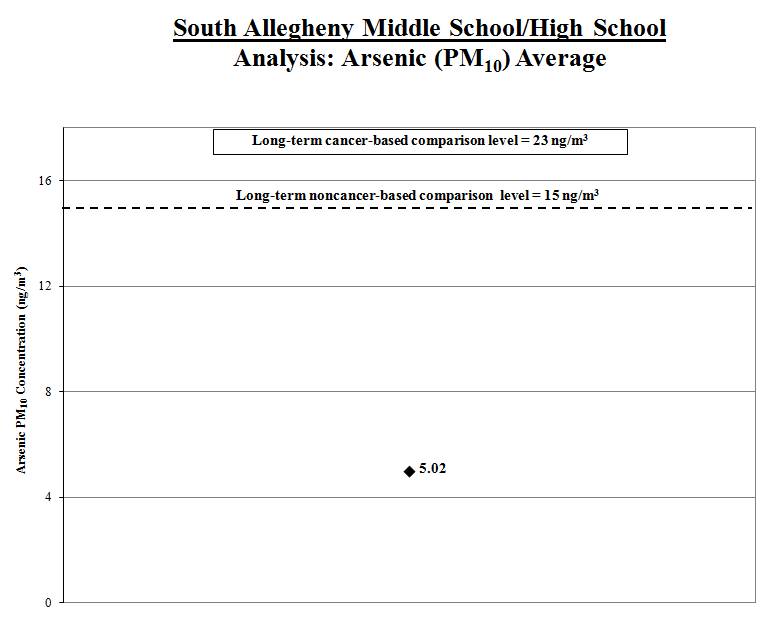
2a. Calculate the arsenic average: We calculated the averages of the arsenic measurements (shown by the black diamond in the graph below). We compared these averages to the long-term comparison levels (see thick line on the graph below).
Result: The average arsenic levels for the samples collected at South Allegheny Middle/High School were below the long-term comparison levels.
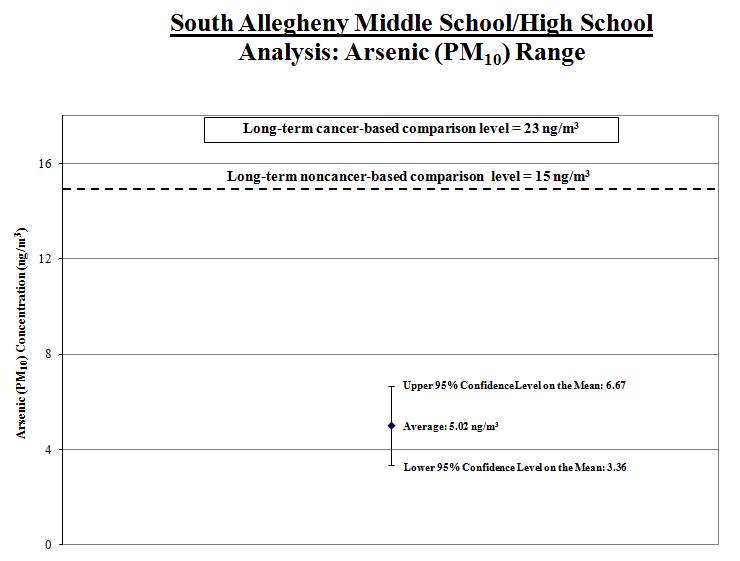
2b. Calculate a range for the arsenic average: To account for varying air concentrations of arsenic, we calculated ranges around the averages. We did this by estimating high and low values that the longer-term concentrations might reach using common statistical tools. We compared the highest points in the ranges (called the “upper bounds”) to the long-term comparison levels.
Result: The high ends of the ranges for the samples collected at South Allegheny Middle/High School are lower than the comparison levels.
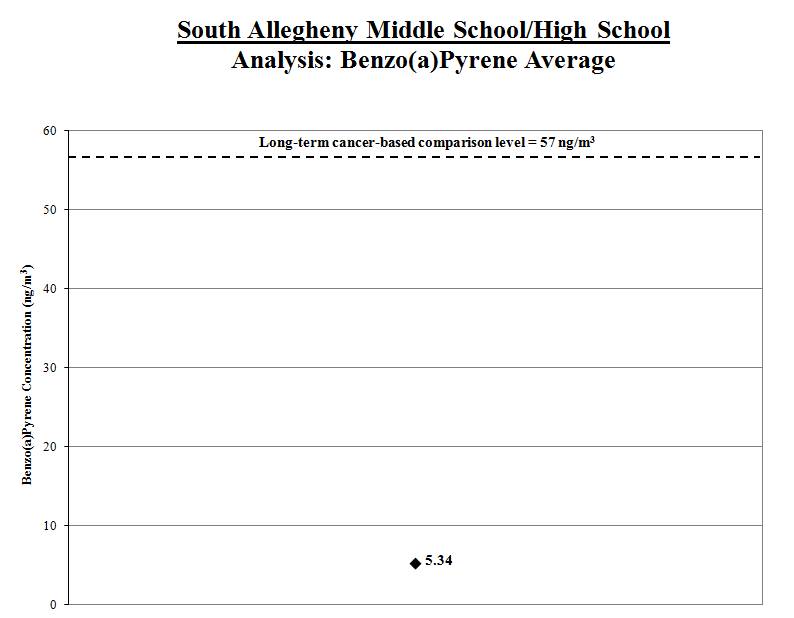
3a. Calculate the benzo(a)pyrene average: We calculated the averages of the benzo(a)pyrene measurements (shown by the black diamond in the graph below). We compared these averages to the long-term comparison levels (see thick line on the graph below).
Result: The average benzo(a)pyrene levels for the samples collected at South Allegheny Middle/High School were well below the long-term comparison levels.
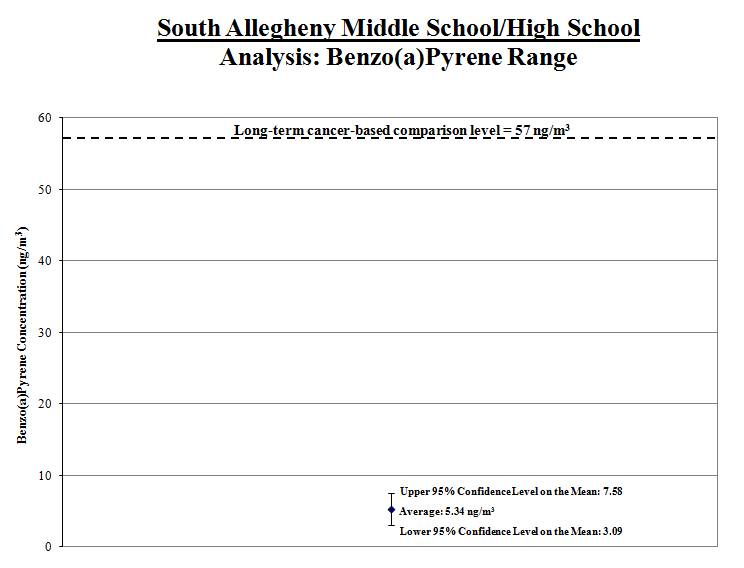
3b. Calculate a range for the benzo(a)pyrene average: To account for varying air concentrations of benzo(a)pyrene, we calculated ranges around the averages. We did this by estimating high and low values that the longer-term concentrations might reach using common statistical tools. We compared the highest points in the ranges (called the “upper bounds”) to the long-term comparison levels.
Result: The high ends of the ranges for the samples collected at South Allegheny Middle/High School are lower than the comparison levels.
Analysis of Measured Wind Direction and Wind Speed at Each School
We took measurements of wind direction and speed every day during the sample period. We took special note of the wind speed and direction on the days we took measurements of benzene, arsenic, and benzo(a)pyrene.
| What we looked at | What we found |
We looked at whether the wind data taken on the days we took measurements of benzene, arsenic, and benzo(a)pyrene are similar or different from the wind patterns during the entire sampling period. |
We found the wind patterns taken on the days we took measurements of benzene, arsenic, and benzo(a)pyrene to be generally similar to those observed during the entire sampling period. |
We looked at whether the wind pattern during the sampling period is reflective of regional wind pattern over the long term. |
The wind pattern at the monitoring station at South Allegheny Middle/High School during the sampling period is generally similar to the historical long-term wind flow pattern at that same school. This suggests that, on a regional scale, the 9-month sampling period may be representative of year-round wind patterns. |
Analysis of Information on Nearby Sources of Benzene, Arsenic, and Benzo(a)pyrene Emissions
| What we looked at | What we found |
Whether we could determine if the sources were operating as usual during the sampling period. |
The nearby sources influencing the air quality at the school have recently taken actions to control air emissions. The facilities will continue control equipment upgrades to meet the PM2.5 SIP that requires compliance with PM2.5 NAAQS within 5 years of approval. One facility has invested nearly $500 million to upgrade older polluting equipment with newer cleaner equipment. In addition, the same facility has applied for government grants to install new, updated quench towers to control particulate pollution. Another nearby contributing facility has installed a new thermal oxidizer that is expected to reduce naphthalene emissions by nearly 68%. These recent upgrades are expected to further reduce the air pollution from the contributing facilities. In addition, the contributing coal burning EGU upwind of the school has recently shut down and is no longer in operation. Emissions from the power plant are no longer impacting S. Allegheny and the surrounding area. |
The concentrations of the key pollutants plus others, and the associated longer-term concentration estimates indicate the potential for the mixture of pollutants in the air to pose concerns for long-term continuous exposures. |
|
| The nearby sources of benzene, arsenic, and benzo(a)pyrene have Title V operating air permits issued by ACHD that includes operating requirements. |
Additional Information
Technical Report for School: Assessing Outdoor Air Near Schools: Additional Monitoring at South Allegheny Middle/High School (McKeesport, PA) (PDF) (37pp, 338k). The technical report is a follow-up to the original monitoring which took place. The report is geared toward risk assessors, risk managers, and other regulatory agencies.
Background on School Monitoring Effort