Assessing Outdoor Air Near Schools
Life Skills of Trumbull County and Academy of Arts and Humanities - Warren, OH
- Understanding the Monitoring Data
- Initial Sample Results
- Initial Analysis
- Additional Sample Results
- Final Analysis
Final Results and Analysis of EPA’s monitoring
EPA selected this school for monitoring because it is located near a coke oven and steel mill, both of which are sources of air toxics emissions. For the purposes of this study, results from the air monitoring at Life Skills of Trumbull County are considered to be indicative of conditions at the nearby Academy of Arts and Humanities. Computer models were used to determine which air toxics may be present at elevated levels in the outdoor air near the school. These models showed that manganese and lead, as well as chemicals associated with coke oven emissions, such as benzene, arsenic, and benzo(a)pyrene, could be present in the air around the school and prompted EPA to test to see if the levels present may be of concern. Monitoring initially took place at Life Skills of Trumbull County from August 17, 2009 through November 27, 2009. It was determined that the coke oven was operating below normal levels during the original monitoring session, and a decision was made to repeat monitoring when the coke oven was operating at normal conditions. Additional monitoring took place from November 29, 2010 through February 8, 2011. Results from the additional monitoring are presented below.
| Primary Findings | Levels of manganese in the air at the school were low during the three-month monitoring period. Levels of levels of lead, a pollutant for which there are national standards for ambient (outdoor) air, are below the level of the national standard for protection of public health. Levels of pollutants associated with coke plant emissions, including benzene, arsenic, and benzo(a)pyrene and associated longer-term concentration estimates were not as high as suggested by the information available prior to monitoring. Although they were below the levels of significant concern that had been suggested by the modeling information, these results indicate the influence of these pollutants of concern emitted from nearby sources. |
| Key Pollutants Monitored | Manganese. Inhalation may affect the nervous system if people are exposed to high levels. |
| Next Steps | Based on the analysis described here, EPA will not extend air toxics monitoring at this school. EPA remains concerned about emissions from sources of air toxics and continues to work to reduce those emissions across the country, through national rules and by providing information and suggestions to assist with reductions in local areas. The Ohio EPA will continue to oversee the industrial facilities in the area through the facilities’ Title V air permits and other programs. |
Summary of Study Approach and Findings
Approach:
- A monitor collected air samples from November 16, 2010 through February 8, 2011 at the Life Skills of Trumbull County in Warren, Ohio. For the purposes of this study, results from the air monitoring at Life Skills of Trumbull County are considered to be indicative of conditions at the nearby Academy of Arts and Humanities.
- During the monitoring period, EPA evaluated the monitored concentrations to see if there was a concern from short-term exposures (e.g., several weeks).
- When the monitoring was complete, EPA experts analyzed the results to see if there was a concern from long-term exposures (over a lifetime).
- Also, when the monitoring was complete, EPA experts evaluated all the air samples from the on-site monitor. They also evaluated information on wind speed and wind direction from a weather monitor at the school, along with historical weather information and information about nearby sources of manganese, lead, benzene, arsenic, and benzo(a)pyrene emissions.
Findings:
- Measured levels of manganese and associated longer-term concentration estimates are below levels of concern.
- Levels of lead, a key pollutant for which there are national standards for ambient (outdoor) air, are below the national standard for protection of public health.
- Measured levels of pollutants associated with coke plant emissions, including benzene, arsenic, and benzo(a)pyrene, and associated long-term concentration estimates were not as high as was suggested by modeling information available prior to monitoring. Although they were below the levels of significant concern for long-term exposure that had been suggested by the modeling, these results indicate the influence of these pollutants of concern emitted from nearby sources.
- The process to identify schools for monitoring relied on emissions estimates and other information. Ambient air monitoring at the school allowed measurement of what was actually in the air.
- During the monitoring period, several of the emission units at the steel mill were not in operation including their coal-fired boiler. Facility emissions for 2010 were 3454 tons compared with 1172 tons for 2009.
- The coke production facility operated at levels varying from 62-66% of normal production levels during the monitoring period.
- Based on the analysis summarized here, EPA will not further extend air toxics monitoring at this school.
- Click here for additional information
How We Analyzed the Information We Collected at this School
The analysis considered whether the information collected at the school might raise concerns for the health of children or adults at the school. We looked at the following types of information:
- Measured manganese, lead, benzene, arsenic, and benzo(a)pyreneconcentrations and information on manganese, lead, benzene, arsenic, and benzo(a)pyrene
- Measured wind direction and wind speed at the school
- Information about nearby sources of manganese, lead, benzene, arsenic, and benzo(a)pyrene emissions
Analysis of Measured Manganese Concentrations:
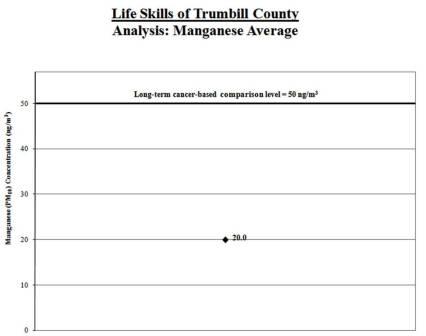
1. Calculate the average: We calculated the average of the manganese measurements (shown by the black diamond in the graph below). We compared this average to the long-term comparison level (thick line on the graph below). The long-term comparison level represents the level of manganese in the air that is below levels associated with health concerns, even if someone breathed air containing manganese at that level all day, every day over their lifetime.
Result: The average manganese level for the samples collected was well below the long-term comparison level. The health concern is low.
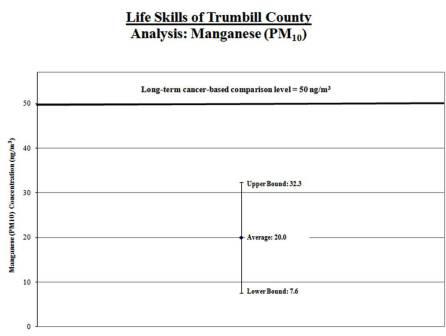
2. Calculate a range: To account for varying air concentrations of manganese, we calculated a range around the average. We did this by estimating high and low values that the longer-term concentrations might reach using common statistical tools. We compared the highest point in the range (called the "upper bound") to the long-term comparison level.
Result: The high end of the range is lower than the comparison level. The health concern is low.
Analysis of Measured Lead Concentrations:
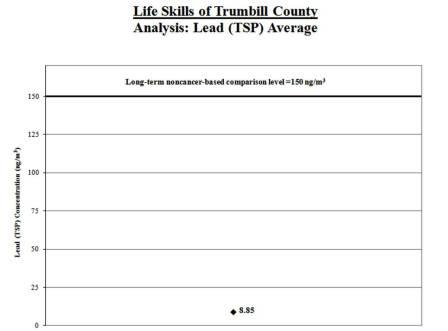
1. Calculate the average: We calculated the average of the lead (TSP) measurements for each of the 3-month periods in which monitoring occurred (the higher of these averages is shown by the black diamond in the graph below). We compared this average to the long-term comparison level (thick line on the graph below). The comparison level is the level of the national ambient air quality standards (NAAQS) for lead, which is for a 3-month averaging period.
Result: The average lead level for the samples collected was well below the comparison level. The health concern is low.
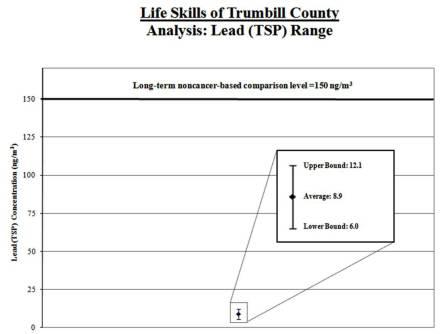
2. Calculate a range: To account for varying air concentrations of lead, we calculated a range around the average by estimating high and low values that the longer-term concentrations might reach using common statistical tools. We compared the highest point in the range (called the “upper bound”) to the comparison level.
Result: The high end of the range is lower than the comparison level. The health concern is low.
Analysis of Measured Concentrations of Other Pollutants:
Levels of the multiple pollutants associated with coke plant emissions, including benzene, arsenic, and benzo(a)pyrene were not as high as suggested by the information available prior to monitoring. Although they were below the levels of significant concern that had been suggested by the modeling information, these results indicate the influence of these pollutants of concern emitted from nearby sources.
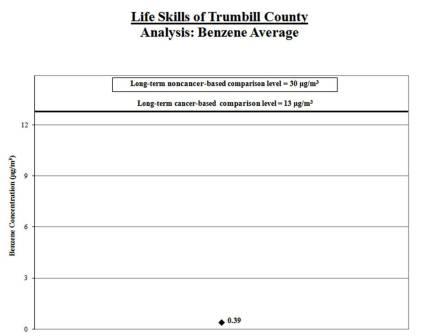
1a. Calculate the benzene average: We calculated the average of the benzene measurements (shown by the black diamond in the graph below). We compared this average to the long-term comparison level (thick line on the graph below).
Result: The average benzene level for the samples collected was below the long-term comparison level.
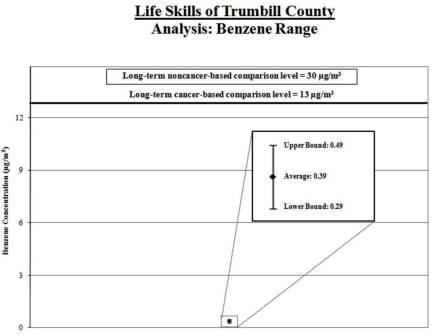
1b. Calculate a range for the benzene average: To account for varying air concentrations of benzene, we calculated a range around the average by estimating high and low values that the longer-term concentrations might reach using common statistical tools. We compared the highest point in the range (called the “upper bound”) to the long-term comparison level.
Result: The high end of the range is lower than the comparison level.
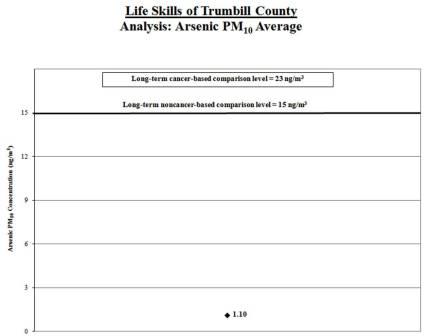
2a. Calculate the arsenic average: We calculated the average of the arsenic measurements (shown by the black diamond in the graph below). We compared this average to the long-term comparison level (thick line on the graph below).
Result: The average arsenic level for the samples collected was below the long-term comparison level.
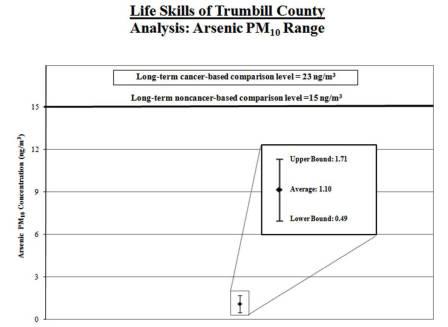
2b. Calculate a range for the arsenic average: To account for varying air concentrations of arsenic, we calculated a range around the average by estimating high and low values that the longer-term concentrations might reach using common statistical tools. We compared the highest point in the range (called the “upper bound”) to the long-term comparison level.
Result: The high end of the range is lower than the comparison level.
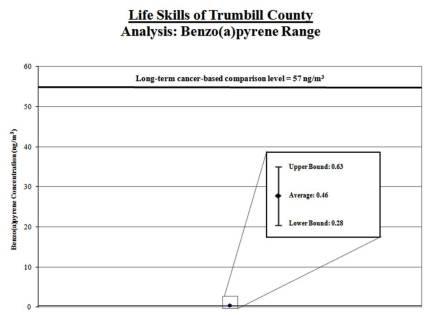
3a. Calculate the benzo(a)pyrene average: We calculated the average of the benzo(a)pyrene measurements (shown by the black diamond in the graph below). We compared this average to the long-term comparison level (thick line on the graph below).
Result: The average benzo(a)pyrene level for the samples collected was below the long-term comparison level.
3b. Calculate a range for the benzo(a)pyrene average: To account for varying air concentrations of benzo(a)pyrene, we calculated a range around the average by estimating high and low values that the longer-term concentrations might reach using common statistical tools. We compared the highest point in the range (called the “upper bound”) to the long-term comparison level.
Result: The high end of the range is lower than the comparison level.
Analysis of Measured Wind Direction and Wind Speed at the School
We took measurements of wind direction and speed every day during the sample period. We took special note of the wind speed and direction on the days we took measurements of manganese, lead, benzene, arsenic, and benzo(a)pyrene.
| What we looked at | What we found |
| We looked at whether the wind data taken on the days we took measurements of manganese, lead, benzene, arsenic, and benzo(a)pyrene are similar or different from the wind patterns during the entire sampling period. | We found the wind patterns taken on the days we took measurements of manganese, lead, benzene, arsenic, and benzo(a)pyrene to be similar to those observed during the entire sampling period. |
| We looked at whether the wind pattern during the sampling period is reflective of regional wind pattern over the long term. | Although we lack long term wind data at the monitoring station, the wind patterns at the NWS station during the sampling period are generally similar to the historical long-term wind flow pattern at that location. This suggests that, on a regional scale, the 3‑month sampling period may be representative of year-round wind patterns. |
Analysis of Information on Nearby Sources of Manganese, Lead, Benzene, Arsenic, and Benzo(a)pyrene Emissions
| What we looked at | What we found |
Whether we could determine if the sources were operating as usual during the sampling period |
During the monitoring period, several of the emission units from the steel mill were not in operation including their coal-fired boiler. Facility emissions for 2010 were 3,454 tons compared with 1172 tons for 2009. |
The concentrations of manganese, lead, benzene, arsenic, and benzo(a)pyrene measured at the school are lower than those suggested by the information that helped identify this school for monitoring. |
|
The nearby sources of manganese, lead, benzene, arsenic, and benzo(a)pyrene have a Title V operating air permits issued by OEPA that includes operating requirements. |
Additional Information
- Technical Report for School: Assessing Outdoor Air Near Schools: Additional Monitoring at Life Skills of Trumbull County (Warren, OH) (PDF) (43pp, 893k). The technical report is geared toward risk assessors, risk managers, and other regulatory agencies.
- Background on School Monitoring Effort
- General Questions and Answers for School Monitoring Effort