Assessing Outdoor Air Near Schools
Follansbee Middle School and Jefferson Primary School - Follansbee, WV
- Understanding the Monitoring Data
- Initial Sample Results
- Initial Analysis
- Additional Sample Results
- Final Analysis
Results and Analysis of EPA’s Additional Monitoring
EPA selected these schools for monitoring because they are located near a large coke oven, a tar plant, and steel facility, as well as other industries which are sources of air toxics emissions. For the purposes of this study, results from the air monitoring at Follansbee Middle School are considered to be indicative of conditions at the nearby Jefferson Primary School (located within a half mile of Follansbee Middle School). Air monitoring was initially conducted at Follansbee Middle School from August 11, 2009 to December 15, 2009 to assess concentrations of benzene and other volatile organic compounds (VOCs); arsenic and other metals in particulate matter less than 10 microns (PM10); and benzo(a)pyrene and other polycyclic aromatic hydrocarbons (PAHs) in the air. EPA extended air toxics monitoring at Follansbee Middle School to better characterize exposure to that community from the nearby coke oven, tar plant, and the steel facility. This information from the 2009 monitoring is provided in the first report (PDF) (40pp, 599k). Additional monitoring for benzene and other VOCs, arsenic and other PM10 metals, and benzo(a)pyrene and other PAHs were conducted at Follansbee Middle School from October 28, 2011 to August 9, 2012.
| Primary Findings | The levels of benzene, arsenic, and benzo(a)pyrene measured in the outdoor air over this ten-month period continue to indicate the influence of nearby sources. The air sampling data collected for two of these three monitored pollutants indicate levels similar to levels in prior sampling period. Levels of benzene, however, are appreciably lower. The data collected for the key and other air toxics and the associated longer-term concentrations estimates indicate levels near those that might pose concerns for cumulative health risk from these pollutants. |
| Key Pollutants Monitored | Benzene. Inhalation of benzene at high levels can affect the bone marrow and can cause anemia and leukemia. |
| Next Steps | Based on the analysis described here, EPA will not extend air toxics monitoring at this location. EPA remains concerned about emissions from sources of air toxics and continues to work to reduce those emissions across the country, through national rules and by providing information and suggestions to assist with reductions in local areas. The West Virginia Department of Environmental Protection (WVDEP) will continue to oversee industrial facilities in the Follansbee area through air permits and other programs. The Ohio Environmental Protection Agency (OHEPA) will continue to oversee industrial facilities to the west of Follansbee on the other side of the Ohio River. |
Summary of Study Approach and Findings
Approach:
- A monitor collected air samples from October 28, 2011 through August 9, 2012 at Follansbee Middle School in Follansbee, WV.
- Individual air sample results are posted on this website.
- When the monitoring was complete, we analyzed the results to see if there was a concern from long-term concentrations (over a lifetime).
- Also, when the monitoring was complete, we evaluated all the air samples from the on-site monitor. We also evaluated information on wind speed and wind direction from a weather monitor at the school, along with historical weather information and information about nearby sources of benzene, arsenic, and benzo(a)pyrene emissions.
Findings:
- Measured values of benzene, arsenic (PM10), benzo(a)pyrene, and other monitored pollutants indicate an influence of the source at this school.
- The process to identify schools for monitoring relied on emissions estimates and other information. Ambient air monitoring at the school allowed measurement of what was actually in the air.
- The coke making facility near Follansbee Middle School was operating between 40 and 100% of capacity with an average operating rate of 70% of capacity during the majority of the time additional monitoring was conducted. However, in June 2012, the facility ceased coke making operations at 3 of the 4 coke batteries. The 3 coke batteries were put in a "hot idle" state by the company and did not produce coke. Currently, the coke oven gas from the lone operating battery is being cleaned and recycled for use in keeping the other three idled batteries "hot" and available for coke production should market demand increase. In addition, the steel making facility located in Steubenville, Ohio just across the river from Follansbee discontinued operations in 2005. The land has since been sold for redevelopment and the 2 blast furnaces at that location were recently demolished. The Mingo Junction, Ohio steel facilities, located slightly downriver of Follansbee, shut down between 2008 and 2009.
- Based on these findings, EPA will not extend air toxics monitoring at Follansbee Middle School.
- Click here for additional information
How We Analyzed the Information We Collected at this School
The analysis considered whether the information collected at these schools might raise concerns for the health of children or adults at these schools. We looked at the following types of information:
- Measured benzene, arsenic, and benzo(a)pyrene concentrations and information on benzene, arsenic, and benzo(a)pyrene
- Measured wind direction and wind speed at these schools
- Information about nearby sources of benzene, arsenic, and benzo(a)pyrene emissions
Analysis of Measured Manganese Concentrations:
At Follansbee Middle School, benzene, arsenic (PM10), benzo(a)pyrene, and other monitored pollutants indicate an influence of the sources at this school. The complete analyses of these data indicate the potential for levels of concern for long-term, continuous exposure to benzene individually, and to the mixture of these pollutants in areas of this neighborhood.
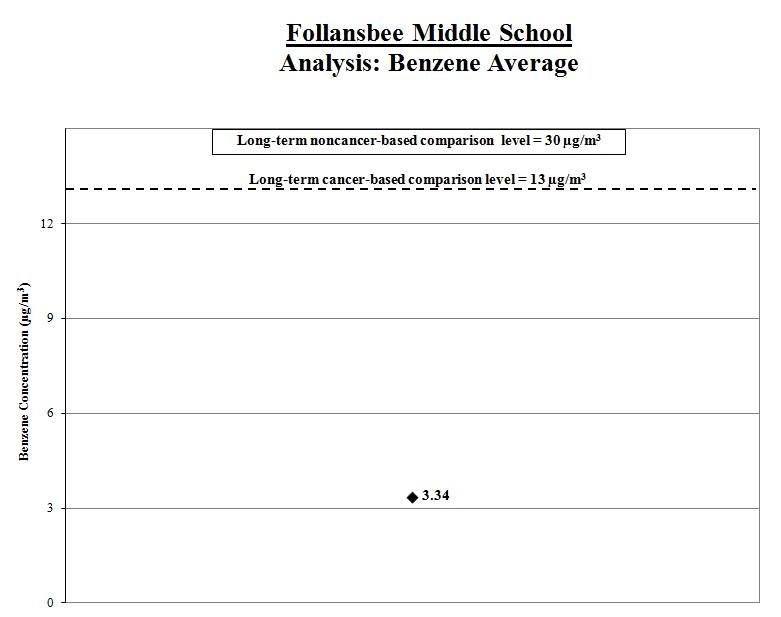
1a. Calculate the benzene average: We calculated the averages of the benzene measurements (shown by the black diamond in the graph below). We compared these averages to the long-term comparison levels (see thick line on the graph below).
Result: The average benzene levels for the samples collected at Follansbee Middle School were below the long-term comparison levels.
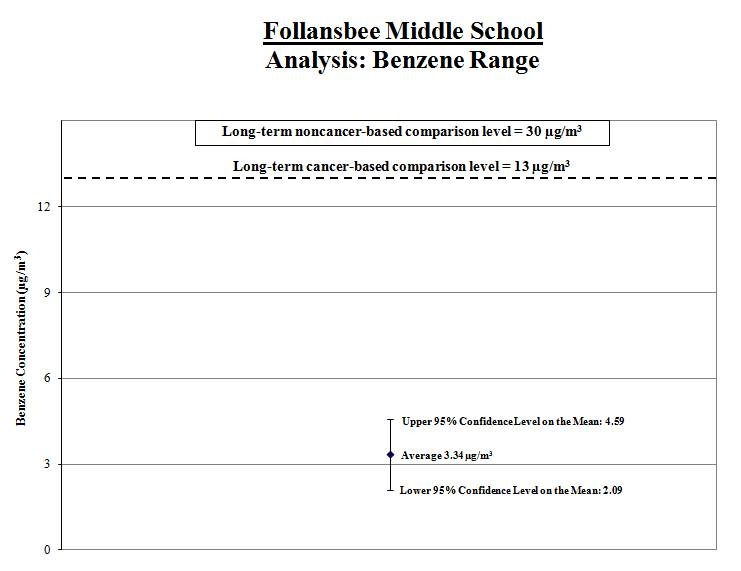
1b. Calculate a range for the benzene average: To account for varying air concentrations of benzene, we calculated ranges around the averages. We did this by estimating high and low values that the longer-term concentrations might reach using common statistical tools. We compared the highest points in the ranges (called the “upper bounds”) to the long-term comparison levels.
Result: The high ends of the ranges for the samples collected at Follansbee Middle School are lower than the comparison levels.
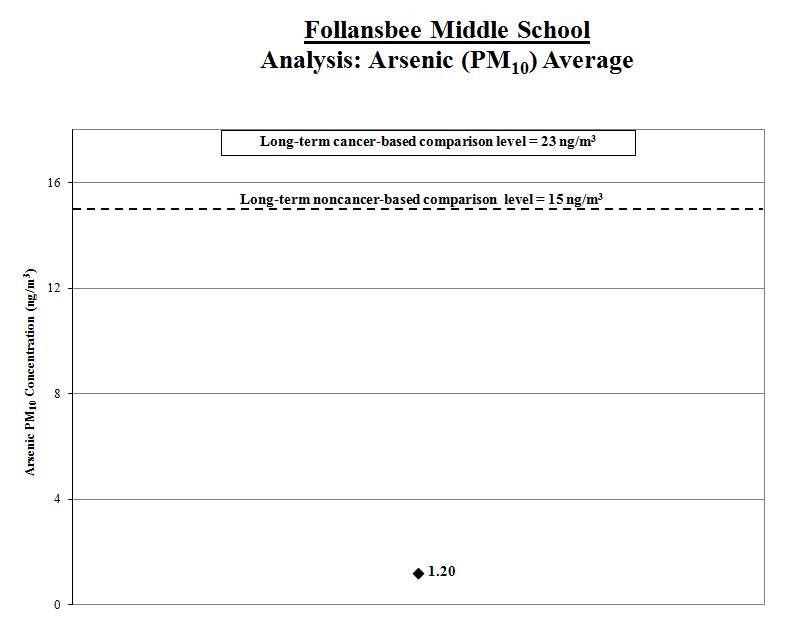
2a. Calculate the arsenic average:We calculated the averages of the arsenic measurements (shown by the black diamond in the graph below). We compared these averages to the long-term comparison levels (see thick line on the graph below).
Result: The average arsenic levels for the samples collected at Follansbee Middle School were below the long-term comparison levels.
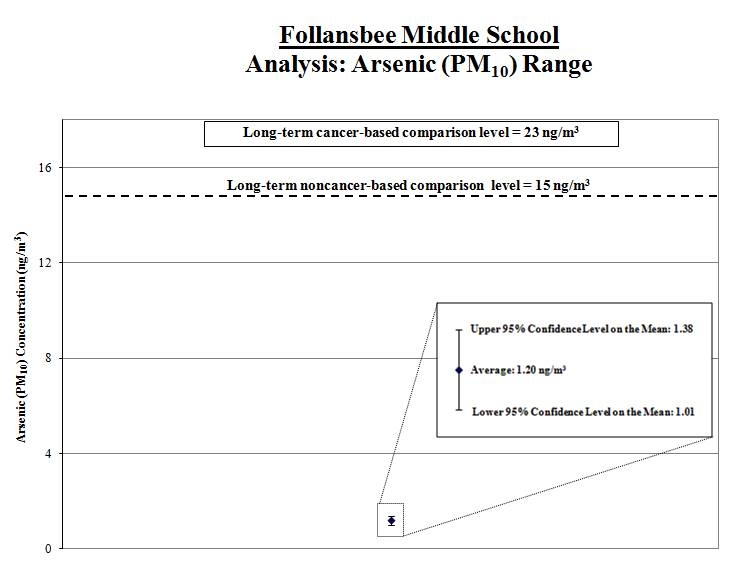
2b. Calculate a range for the arsenic average: To account for varying air concentrations of arsenic, we calculated ranges around the averages. We did this by estimating high and low values that the longer-term concentrations might reach using common statistical tools. We compared the highest points in the ranges (called the “upper bounds”) to the long-term comparison levels.
Result: The high ends of the ranges for the samples collected at Follansbee Middle School are lower than the comparison levels.
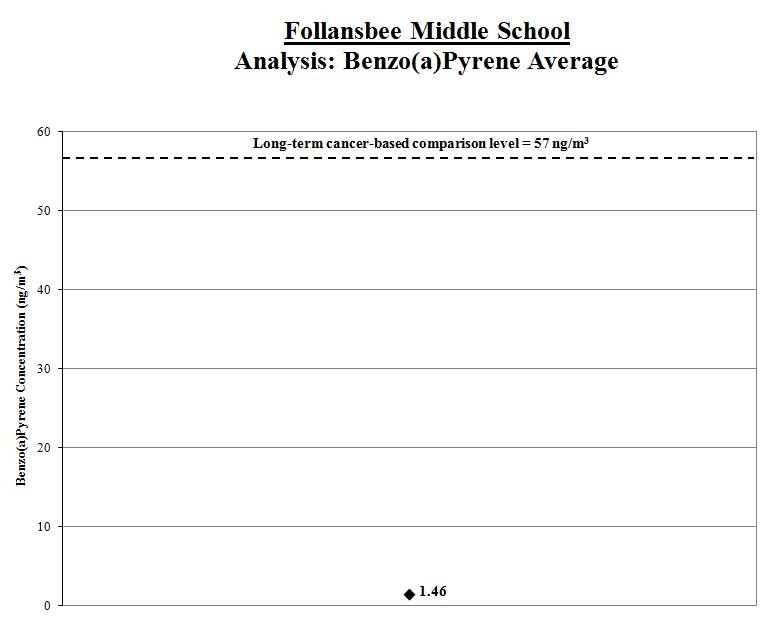
3a. Calculate the benzo(a)pyrene average:We calculated the averages of the benzo(a)pyrene measurements (shown by the black diamond in the graph below). We compared these averages to the long-term comparison levels (see thick line on the graph below).
Result: The average benzo(a)pyrene levels for the samples collected at Follansbee Middle School were well below the long-term comparison levels.
3b. Calculate a range for the benzo(a)pyrene average: To account for varying air concentrations of benzo(a)pyrene, we calculated ranges around the averages. We did this by estimating high and low values that the longer-term concentrations might reach using common statistical tools. We compared the highest points in the ranges (called the “upper bounds”) to the long-term comparison levels.
Result: The high ends of the ranges for the samples collected at Follansbee Middle School are lower than the comparison levels.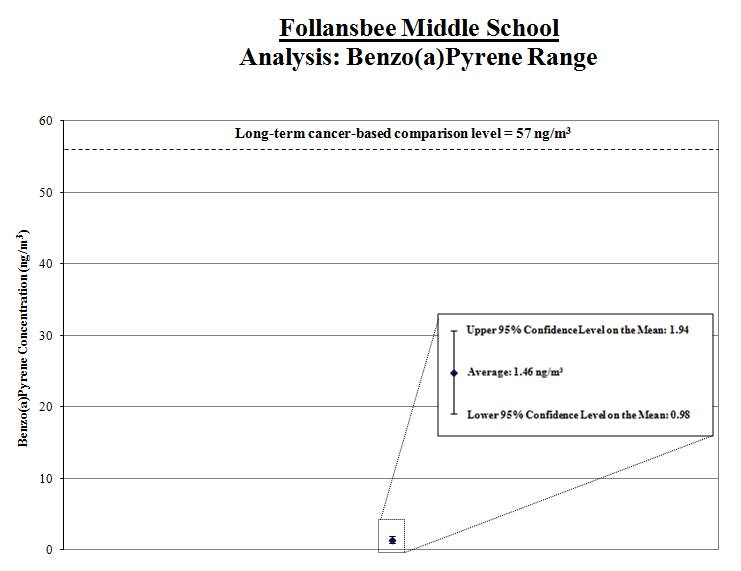
Analysis of Measured Wind Direction and Wind Speed at This School
We took measurements of wind direction and speed every day during the sample period. We took special note of the wind speed and direction on the days we took measurements of benzene, arsenic, and benzo(a)pyrene.
What we looked at |
What we found |
We looked at whether the wind data taken on the days we took measurements of benzene, arsenic, and benzo(a)pyrene are similar or different from the wind patterns during the entire sampling period. |
We found the wind patterns taken on the days we took measurements of benzene, arsenic, and benzo(a)pyrene to be generally similar to those observed during the entire sampling period. |
We looked at whether the wind pattern during the sampling period is reflective of regional wind pattern over the long term. |
The historical data from the National Weather Service (NWS) station indicates that winds are predominantly from the southwest, which is similar to meteorological data from the school site. |
Analysis of Information on Nearby Sources of Benzene, Arsenic, and Benzo(a)pyrene Emissions
| What we looked at | What we found |
Whether we could determine if the sources were operating as usual during the sampling period. |
The coke plant was operating at a rate between 40% and 100% of capacity during the sampling period with an average operating rate of 70% of capacity. Of the four total batteries, batteries 1, 2, and 3 were placed on idle in June 2012, approximately 2 months prior to the end of the ten-month sampling period. Emissions during this 2 month period would have been less than that of the preceding 10 months of sampling. With the 3 batteries on idle, the coke plant is expected to be operating at less than normal capacity in the foreseeable future. Production rates at the coke battery are variable and market driven. The tar plant was operating at normal capacity (46%) during the sampling period. |
The concentrations of the key pollutants plus others, and the associated longer-term concentration estimates indicate the potential for the mixture of pollutants in the air to pose concerns for long-term continuous exposures. |
|
| The nearby sources of benzene, arsenic, and benzo(a)pyrene have Title V operating air permits issued by WVDEP and OHEPA that includes operating requirements. |
Additional Information
Technical Report for School: Assessing Outdoor Air Near Schools: Additional Monitoring at Follansbee Middle School and Jefferson Primary School (Follansbee, WV) (PDF) (34pp, 387k). The technical report is a follow-up to the original monitoring which took place. The report is geared toward risk assessors, risk managers, and other regulatory agencies.
Background on School Monitoring Effort