Environmental Indicators
National Information
- Indicators - Definition & Criteria
- EPA's Report on the Environment
- Aquatic Indicators
- Nutrient Pollution Policy and Data
- Centers for Disease Control and Prevention - National Center for Env'l Health
- Amrerica's Children and the Environment
- Indicators & Linkages for Communities
- Innovations in Program Management: Environmental Indicators and Outcome Metrics - Country Examples
- National Water Program Strategic Plan & Guidance
- Regional Vulnerability Assessment
- Risk Screening Environmental Indicators
- Sustainable Development Indicators
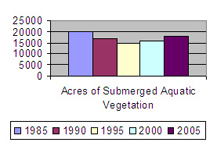
In this example the indicator is "Acres of Submerged Aquatic Vegetation" - the greater the number, the better the health of the ecosystem.
Mid-Atlantic Information
Related Mid-Atlantic Information 
- Report on the Environment: Indicators Presenting Data for EPA Region 3 (PDF) (111 pp, 15MB, About PDF)
- Watershed Indicators - Maryland Dept. of Natural Resources
- Maryland Coastal Bays 2008 Report Card (PDF) (5 pp, 4MB, About PDF)
- Reduction of Toxics in State Waters Report - January 2015 - Virginia Dept. of Environmental Quality
On this page
What is an Indicator?
An indicator is a measure of something that we want to know the condition of or that we want to track (e.g., environmental condition). Indicators help us understand where we are, where we are going, and how far we are from the goal.
An indicator is information that represents a piece of the system in which we want to decide on an action or make a decision.
A good indicator has the following characteristics (from Indicators and Information Systems for Sustainable Development (PDF). (95pp, 418 KB, About PDF) ) ![]() by D. Meadows, 1998. Balaton Group, The Sustainability Institute.).
by D. Meadows, 1998. Balaton Group, The Sustainability Institute.).
- Clear in value
- Clear in content
- Compelling
- Policy relevant
- Feasible
- Sufficient
- Timely
- Appropriate in scale
- Democratic
- Supplementary
- Participatory
- Hierarchical
- Physical
- Leading
- Tentative
One way to use indicators is to track EPAs programmatic activities. For this, EPA has organized data and measures into six levels that correspond to the type of activity measured.
Indicator Hierarchy
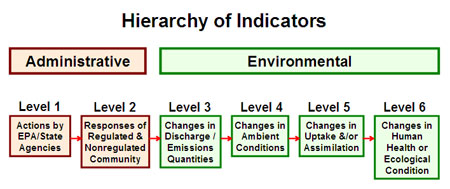
Administrative
Level 1 - resources used and activities taken by governmental agencies and environmental groups, such as permits written or grants issued; designed to result in an action by a second party that reduces or prevents pollution or exposure to pollution
Level 2 - steps taken by entities in response to Level 1 actions to reduce pollutants entering air, water, or land
Environmental
Level 3 - actual amounts of pollutants emitted by sources
Level 4 - levels of pollutants detected in local communities
Level 5 - chemical or biological changes which occur to some pollutants, for example, concentration of a toxin as it moves up the food chain
Level 6 - the true Indicator or condition we seek to attain
EPA has used the Indicator Hierarchy since 1982. It corresponds fairly closely to the categories used in Logic Models to plan activities.
Additional Information
- EPA's Report on the Environment 2008, Indicators Presenting Data for EPA Region 3 (PDF) (111 pp, 15MB, About PDF) - This report lists the most reliable indicators with data specific for EPA Region 3, those that EPA believes are of critical importance to its mission to protect human health and the environment.
- Pressure-State-Response Framework and Environmental Indicators - Food and Agriculture Organization of the United Nations
Contact
Bill Jenkins (jenkins.bill@epa.gov)
Associate Division Director
Office of Environmental Information & Analysis (3EA10)
Environmental Assessment & Innovation Division
US EPA Region 3
1650 Arch St.
Philadelphia, PA 19103-2029
215-814-2911