Human Exposure and Atmospheric Sciences
Air Quality Data for the CDC National Environmental Public Health Tracking Network
Summary
EPA's Exposure Research scientists are collaborating with the Centers for Disease Control and Prevention (CDC) on a CDC initiative to build a National Environmental Public Health Tracking (EPHT) network. Working with state, local and federal air pollution and health agencies, the EPHT program is facilitating the collection, integration, analysis, interpretation, and dissemination of data from environmental hazard monitoring, and from human exposure and health effects surveillance. These data provide scientific information to develop surveillance indicators, and to investigate possible relationships between environmental exposures, chronic disease, and other diseases, that can lead to interventions to reduce the burden of theses illnesses. An important part of the initiative is air quality modeling estimates and air quality monitoring data, combined through Bayesian modeling, that can be linked with health outcome data.
The Hierarchical Bayesian Space Time Modeling System (HBM) supported the Centers for Disease Control and Prevention (CDC) Public Health Air Surveillance Evaluation (PHASE) Project. In the PHASE Project, CDC, EPA, and the public health departments of Wisconsin, New York State, and Maine worked to link air quality monitoring measurement data and air quality HBM estimates for fine particulate matter (PM2.5) and ozone (O3), (provided by EPA), with health outcome data (e.g., asthma and occurrences of myocardial infarction). CDC’s PHASE Project served as one of several “Proof-of-Concept” pilots in the development of CDC’s nation-wide Environmental Public Health Tracking (EPHT) Network, which was formally launched in July 2009. CDC and EPA also worked to transform the HBM estimates into county air quality indicators, which are particularly useful in locations without air quality monitors. 25 US states, 1 city and 5 academic institutions affiliated with CDC’s EPHT Network are users of the HBM air quality predictions.
Research Area
EPA's exposure researchers and air quality experts share their expertise to generate air quality data that can be systematically and routinely available to link with public health surveillance data as part of the EPHT Network. Through an Interagency Agreement with the CDC, EPA is making air quality data available on the EPHT network. CDC provided funding to EPA to support the development and delivery of ambient air quality monitoring data for daily maximum 8-hour ozone and 24-hour average for fine particles (PM2.5) for the years 2001-2011, HBM statistically-combined air quality modeling predictions for these two air pollutants, and associated documentation and metadata for both of these types of data. The air quality monitoring data is obtained from EPA’s Air Quality System (AQS), and is mainly comprised of air quality monitoring data provided by state and local air quality agencies, in the same format used by EPA in its air quality trends reports and other reports. The HBM predictions can be obtained below. These data sets can be found at CDC’s EPHT network portal.
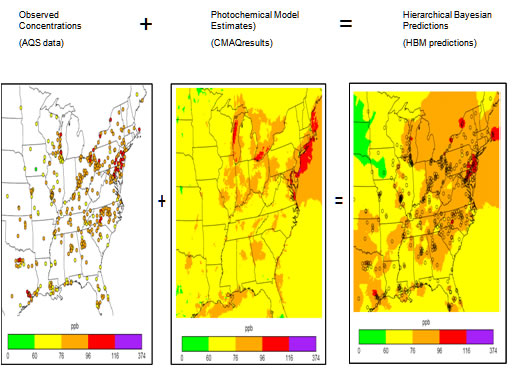
Currently, EPA uses the HBM to 'fuse' daily ozone and fine particle monitoring data from AQS with gridded output from the Models-3/Community Multi-scale Air Quality Model (CMAQ). The scientific basis for the HBM is provided in McMillan, N., Holland, D. M., Morara, M., and Feng, J. (2010). Environmetrics 21, 48-65 ![]() . This model is used to provide daily, gridded estimates of PM2.5 (daily average) and O3 (daily 8-hr maximum) surfaces for years beginning in 2001. Estimates are available for the 12 km (Eastern US) and 36 km (contiguous 48 US states) CMAQ domains. The HBM estimates the distribution of air pollution levels (PM2.5 and O3) across the U.S. for consecutive 24-hour periods within a given time interval (one day up to one-year). The inputs to the HBM model are: a) air quality monitor measurement data from EPA’s Air Quality System (AQS), and; b) air quality modeling estimates from an Eulerian, photochemical, grid-based air quality model, CMAQ. The monitor measurement data and modeling estimates are processed through a Markov-Chain, Monte Carlo (MCMC) algorithm to generate PM2.5 and O3 concentration values for each grid location throughout the US. HBM processes air quality monitor measurement data (accurate, but lacking complete spatial coverage) and air quality modeling estimates (complete spatial coverage, but ‘biased’ statistically) to generate PM2.5 and O3 concentration surfaces that better represent the ‘true’ underlying ambient concentration value at any point in time and space. HBM can generate concentration surfaces from its output to allow scientists to visualize the temporal and spatial variance of PM2.5 and O3 pollutant concentrations.
. This model is used to provide daily, gridded estimates of PM2.5 (daily average) and O3 (daily 8-hr maximum) surfaces for years beginning in 2001. Estimates are available for the 12 km (Eastern US) and 36 km (contiguous 48 US states) CMAQ domains. The HBM estimates the distribution of air pollution levels (PM2.5 and O3) across the U.S. for consecutive 24-hour periods within a given time interval (one day up to one-year). The inputs to the HBM model are: a) air quality monitor measurement data from EPA’s Air Quality System (AQS), and; b) air quality modeling estimates from an Eulerian, photochemical, grid-based air quality model, CMAQ. The monitor measurement data and modeling estimates are processed through a Markov-Chain, Monte Carlo (MCMC) algorithm to generate PM2.5 and O3 concentration values for each grid location throughout the US. HBM processes air quality monitor measurement data (accurate, but lacking complete spatial coverage) and air quality modeling estimates (complete spatial coverage, but ‘biased’ statistically) to generate PM2.5 and O3 concentration surfaces that better represent the ‘true’ underlying ambient concentration value at any point in time and space. HBM can generate concentration surfaces from its output to allow scientists to visualize the temporal and spatial variance of PM2.5 and O3 pollutant concentrations.
Discussion
The HBM estimates (estimated concentration surfaces) are intended for use by statisticians and environmental scientists interested in the spatial distribution of pollution over daily time periods. The estimated concentration surfaces archived here are part of a research program in developing statistical fusion models at EPA and were developed specifically for the EPHT network. These concentration surfaces could be used in modeling public health – air quality relationships, modeling ecosystem reactions to atmospheric inputs, and determining geographic areas with high pollution levels. As new space-time statistical models are developed, EPA will evaluate their use for providing improved predictions of air quality. Data inputs and modeling assumptions may change over time as we improve our modeling approach for fitting fused predictive air quality surfaces. For example, on EPA’s Statistically Fused Air & Deposition Surfaces webpage slightly different air quality surfaces are provided. The main difference between these sets of surfaces is the treatment of multiple monitors at single monitoring site, with the initial HBM predictions using the most prevalent monitor at the site and the subsequent predictions using all monitors at any site.
Data and Metadata Files
| File Descriptions | Downloads |
AQS (Ozone) Monitor Data (2001 – 2011): County/MSA (Ozone): |
AQS OZONE County/MSA Format DATA FILES 2001 - oz82001ctymsa.csv AQS OZONE METADATA DESCRIPTION FILES 2001 - EPHT_oz82001ctymsa_xml_esh_EPA.doc |
| Monitor (Ozone) The data contained in these files include: the site numeric identification number for each Air Quality System ozone monitor (AQS_SITE_ID); the parameter occurrence code (POC), a numeric value used to distinguish between multiple monitors at a site measuring the same pollutant; the date on which the maximum 8-hour average ozone concentration ‘sample’ was taken for each Air Quality System ozone monitor (SAMPLE_DATE); the latitude (LAT), a numeric value in decimal degrees (i.e., 30.498001); the longitude (LON), a numeric value in decimal degrees (i.e., -87.881412); the datum (DATUM), used to determine the earth spheroid used as the basis of earth measurement (i.e., NAD27, WGS84); the elevation (ELEVATION) of the ozone monitor in meters; the numeric value of ambient ozone concentration (OZONE_CONCENTRATION), i.e., 0.03000, measured by an ozone monitor; the units of measurement (UNITS) used for ambient ozone concentration as measured by an ozone monitor, i.e., parts per million (ppm); the percent complete (PERCENT_COMPLETE), represents the percentage of valid measurements taken by an ozone monitor in a day (minimum acceptable value – 75%); [OPTIONAL] - the flag (FLAG), is an indicator of special events which helps explain the particular air quality on a given day, i.e., forest fire, Sahara dust, volcanic eruption, etc. [OPTIONAL]; the description of the location (LOCATION) of the monitor, i.e., suburban; the numeric FIPS Code designating the state (STATE) the ozone monitor is located in, i.e., 01; the numeric FIPS Code designating the county (COUNTY) the ozone monitor is located in, i.e., 003; the numeric FIPS Code designating the Metropolitan Statistical Area (MSA) the ozone monitor is located in, i.e., 5160. The link to the data and metadata in the monitor format for ozone is provided to the right. |
AQS OZONE Monitor DATA FILES 2001 - oz82001monitor.csv AQS OZONE METADATA DESCRIPTION FILES 2001 - EPHT_oz82001monitor_xml_esh_EPA.doc |
AQS (PM2.5) Monitor Data (2001 – 2011): County/MSA (PM2.5) |
AQS PM2.5 County/MSA Format DATA FILES 2001 - p252001ctymsa.csv AQS PM2.5 METADATA DESCRIPTION FILES 2001 - EPHT_p252001ctymsa_xml_esh_EPA.doc |
| Monitor (PM2.5) The data contained in these files include: the site numeric identification number for each Air Quality System PM2.5 monitor (AQS_SITE_ID); the parameter occurrence code (POC), a numeric value used to distinguish between multiple monitors at a site measuring the same pollutant; the date on which the maximum 24-hour average PM2.5 concentration ‘sample’ was taken for each Air Quality System PM2.5 monitor (SAMPLE_DATE); the latitude (LAT), a numeric value in decimal degrees (i.e., 30.498001); the longitude (LON), a numeric value in decimal degrees (i.e., -87.881412); the datum (DATUM), used to determine the earth spheroid used as the basis of earth measurement (i.e., NAD27, WGS84); the elevation (ELEVATION) of the PM2.5 monitor in meters; the numeric value of ambient PM2.5 concentration (PM2.5_CONCENTRATION), i.e., 9.1, measured by an PM2.5 monitor; the units of measurement (UNITS) used for ambient PM2.5 concentration as measured by an PM2.5 monitor, i.e., micrograms per cubic meter (ug/M3); the percent complete (PERCENT_COMPLETE), represents the percentage of valid measurements taken by an PM2.5 monitor in a day (minimum acceptable value – 100%); [OPTIONAL] - the flag (FLAG), is an indicator of special events which helps explain the particular air quality on a given day, i.e., forest fire, Sahara dust, volcanic eruption, etc. [OPTIONAL]; the description of the location (LOCATION) of the monitor, i.e., suburban; the numeric FIPS Code designating the state (STATE) the PM2.5 monitor is located in, i.e., 01; the numeric FIPS Code designating the county (COUNTY) the PM2.5 monitor is located in, i.e., 003; the numeric FIPS Code designating the Metropolitan Statistical Area (MSA) the PM2.5 monitor is located in, i.e., 5160. The link to the data and metadata in the monitor format for PM2.5 is provided to the right. |
PM2.5 Monitor DATA FILES 2001 - p252001monitor.csv PM2.5 METADATA DESCRIPTION FILES 2001 - EPHT_p252001monitor_xml_esh_EPA.doc |
HBM Modeling Data (2001 – 2008) Ozone Modeling Data (12km and 36km grid resolution): |
HBM OZONE SURFACE OUTPUT FILES 1. Ozone Model Ooutput 12km Resolution 36km Resolution 2. HBM Ozone Surface Metadata Descriptions 12km Resolution 36km Resolution |
| PM2.5 Modeling Data (12km and 36km grid resolution): The pm25Surface_XXkm_20ZZ files (where XX is 12 or 36, and ZZ is the selected year, e.g., 01, 02, 03, etc.) are the output data files from the HBM model that statistically combine/fuse ozone monitoring data from National Air Monitoring Stations/State and Local Air Monitoring Stations (NAMS/SLAMS) located in EPA’s AQS database and simulated PM2.5 data from deterministic air quality estimation models, Models-3/Community Multiscale Air Quality (CMAQ). The files contain the posterior (statistical) means and standard errors of the estimated space-time surface for a surface made of 12 km x 12 km or 36 km x 36 km contiguous grids. The contiguous 12 km x 12 km grids cover the eastern United States, while the contiguous 36 km x 36 km grids cover the entire continental United States. Finally, the time frame of interest is January 1, 20ZZ through December 30, 20ZZ each year. The files include the following variables: Date, Latitude, Longitude, Grid Row (row), Grid Column (col), Posterior mean estimated PM2.5 concentration in ug/m3 (PM25_pred), and Standard error of the estimated PM2.5 concentration (PM25_stdd). The link to the HBM data and metadata for PM2.5 is provided to the right and the metadata data are stored in .xml format. |
HBM PM2.5 Surface Model Output Files 12 km RESOLUTION 36 km RESOLUTION HBM PM2.5 Surface Metadata Descriptions 12km Resolution 36km Resolution |
| Annual Reports (for CDC: 2001 - 2006) – HBM Only: The reports describe EPA’s HBM-generated estimates of O3 and PM2.5 concentrations throughout the continental United States during the 2001 - 2006 calendar years. HBM estimates provide the spatial and temporal variance of O3 and PM2.5, allowing estimation of their concentration values across the U.S., independent of where air quality monitors are physically located. HBM estimates are generated through the statistical ‘fusion’ of measured air quality monitor concentration values and air quality model predicted concentration values from EPA’s Community Multiscale Air Quality (CMAQ) computer model. Information on EPA’s air quality monitors, CMAQ model, and HBM model is included to provide the background and context for understanding the data output presented in each report. The reports are provided in *.PDF file format. The link to the 2001 – 2006 Annual Reports for CDC, developed by EPA is provided to the right. |
2001 – 2006 CDC ANNUAL REPORTS 2001 (PDF, 164 pp, 14.5MB) |
Correlation of Semi-Continuous Monitor and Federal Reference Monitor (FRM) Measurements for PM 2.5: |
Technical Report: |