 Northern
California Metric Maps Northern
California Metric Maps
3
Kilometer Grid
U_INDEX
Human Land Use
RHUM0
Stream Cooridor
RHUM30
30 Meter
RHUM90
90 Meter
 N_INDEX
Natural Land Use N_INDEX
Natural Land Use 
RNAT0
Stream Cooridor
RNAT30
30 Meter
RNAT90
90 Meter
PBAR
Barren
RBAR0
Stream Cooridor
RBAR30
30 Meter
RBAR90
90 Meter
PAGT
Agriculture
RAGT0
Stream Cooridor
RAGT30
30 Meter
RAGT90
90 Meter
PAGC
Cropland
RAGC0
Stream Cooridor
RAGC30
30 Meter
RAGC90
90 Meter
PAGP
Pasture
RAGP0
Stream Cooridor
RAGP30
30 Meter
RAGP90
90 Meter
PURB
Urban
RURB0
Stream Cooridor
RURB30
30 Meter
RURB90
90 Meter
PWETL
Wetland
RWETL0
Stream Cooridor
RWETL30
30 Meter
RWETL90
90 Meter
PFOR
Forest
RFOR0
Stream Cooridor
RFOR30
30 Meter
RFOR90
90 Meter
PNG
Natural Grassland
RNG0
Stream Cooridor
RNG30
30 Meter
RNG90
90 Meter
PSHRB
Shrubland
RSHRB0
Stream Cooridor
RSHRB30
30 Meter
RSHRB90
90 Meter
AGCSL3
Ag Steep Slopes
AGPSL3
Pasture Steep Slopes
AGTSL3
Total Steep Slopes
C
Diversity
H
Diversity, Shannon Weiner Index
H
- prime Diversity, Shannon Weiner Index
S
Diversity
N_Load
Nitrogen Load
P_Load
Phosphorus Load
Impervious/Land
Class
Impervious/Road
Density
STRMLEN
Stream Length
STRMDENS
Stream Density
RDLEN
Road Length
RDLENCINTE
Interstates
RDLENCHIGH
Highways
RDLENCROAD
Surface Road
RDDENS
Road Density
RDDENSCINT
Interstates
RDDENSCHIG
Highways
RDDENSCROA
Surface Road
FNUMBER
Forest Patches
FPATDENS
Forest Density
FLARGEST
Largest Forest
FAVGSIZE
Average Forest
PLGP
Proportion of Forest
FEDGE210
Forest Edge
FCORE210
Forest Interior
FEA210
Forest Edge/Total
PFF9
Forest Cell
PFPTCH9
Grid/Patch Forest
PFTRAN9
Grid/Transitional
PFEDGE9
Watershed/Edge Forest
PFPERF9
Grid/Perforated
PFINTR9
Grid/Interior
REGFAC_COUNT
Regulated Facilities
MINES_COUNT
Mines
POPDENS
Population Density
|
 Larger
Image Larger
Image
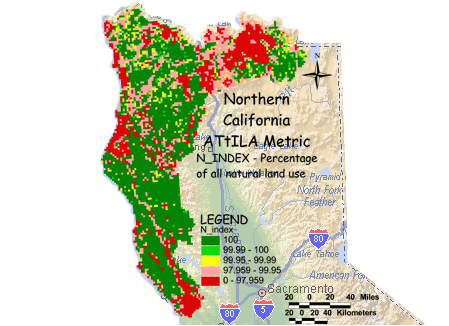
N_INDEX - Percentage of all natural land use
The N-Index (all natural use index) metric is the percentage of land cover cells located within the 3 km grid cell reporting unit that are classified as either forest, shrub
land, grassland, wetland, or bare rock to the total number of cells inside the grid cell boundary minus those cells classified as water (total land area). This gives the
proportion of land area in the grid cell that is in a natural state, but provides no information on the health of the vegetation cover. The N-index shows areas in which
land use practices could have less disturbance from human use and is usually the inverse of the U-Index. The values seen here in the Northern California mountain
area are generally much higher compared to the central and eastern United States.
|