| Table 1. The Properties of Analytes
and Surrogates Used for Quantitation. |
| |
retention timea
(min)
|
quantitation ion
|
secondary ion(s)
|
relative volatility
(aKOA)b |
| surrogates |
|
|
| fluorobenzene |
9.91 |
96 |
70
|
690 |
| 1,4-difluorobenzene |
10.06 |
114 |
63
|
860 |
| toluene-d8 |
13.02 |
98 |
100, 99
|
2200 |
| 1,2-dibromoethane-d4 |
15.44 |
111 |
113
|
5000 |
| o-xylene-d10 |
17.81 |
98 |
116
|
8400 |
| bromobenzene-d5 |
20.05 |
161 |
163, 82
|
12000 |
| 1,2-dichlorobenzene |
22.65 |
152 |
150
|
22000 |
| 1,2,4-trichlorobenzene |
24.75 |
183 |
185
|
41000 |
| naphthalene-d8 |
25.03 |
136 |
108
|
57000 |
| analytes |
|
|
| benzene |
9.45 |
78 |
77
|
460 |
| toluene |
13.18 |
91 |
92
|
2100 |
| tetrachloroethene |
14.6 |
166 |
164
|
6100 |
| ethylbenzene |
16.79 |
106 |
91
|
5000 |
| m,p-xylene |
16.97 |
106 |
91
|
4500 |
| 1,4-dichlorobenzene |
22.14 |
146 |
148
|
20000 |
| naphthalene |
25.07 |
128 |
108
|
41000 |
a Retention times were determined using 60-m x 0.53-mm
i.d., 3.0-µm film thickness VOCOL column.
Temperature program was: 3 min at 10 °C, 50 °C/min ramp to 40 °C;
5 °C/min ramp to 120 °C; 20 °C/min to
220 °C and held at 220 °C to end of run.
b Relative volatility values from ref 7.
| Table 2. Physical Properties
of Leaves. |
| |
Dry-weight |
density |
surface |
diameter |
length |
| leaf |
(%) |
g/cm3 |
cm2/g |
cm |
cm |
| grass |
22.7 |
0.82a |
173 |
NAb |
2 |
| mock orange |
34.7 |
0.90c |
66 |
NA |
2 |
| pine |
48.9 |
0.90c |
61 |
0.81 |
NA |
| rosemary |
21.7 |
0.90c |
64 |
0.143 |
NA |
a Value from ref 9.
b Data not required to determine laminar flow boundary.
c Estimated values.
| Table 3.
Bioconcentration Factors and Enthalpy of Phase Change for VOCs
in Leaves. |
| |
|
grass |
mock
orange |
pine |
rosemary |
| |
|
BCFa |
DHPA
kJ/mol |
BCF |
DHPA
kJ/mol |
BCF |
DHPA
kJ/mol |
BCF |
DHPA
kJ/mol |
| |
Hvbb |
Ic |
IId |
I |
II |
I |
II |
I |
II |
| compound |
kJ/mol |
avg |
dev |
avg |
deve |
avg |
dev |
avg |
dev |
avg |
dev |
avg |
dev |
avg |
dev |
avg |
dev |
| benzene |
30.7 |
NAf |
136 |
32.7 |
0.5(3) |
NA |
150 |
31.0 |
0.3(3) |
NA |
98 |
35.4 |
2.6(6) |
NA |
206 |
35.3 |
2.9(6) |
| toluene |
33.2 |
200 |
70 |
244 |
32.7 |
1.5(7) |
590 |
230 |
315 |
29.9 |
0.6(4) |
2300 |
1800 |
574 |
34.1 |
1.5(5) |
14000 |
6000 |
3056 |
38.1 |
2.0(5) |
| tetrachloroethene |
34.7 |
220 |
190 |
190 |
31.9 |
6.6(2) |
350 |
320 |
382 |
36.0 |
(1) |
440 |
80 |
485 |
35.6 |
0.5(3) |
5400 |
8100 |
1648 |
37.3 |
1.8(3) |
| ethylbenzene |
35.6 |
350 |
240 |
235 |
33.6 |
2.0(6) |
1600 |
900 |
954 |
31.1 |
1.8(4) |
1800 |
1300 |
2093 |
37.9 |
1.2(5) |
11000 |
7000 |
2158 |
37.3 |
3.2(6) |
| m,p-xylenes |
35.7 |
420 |
200 |
299 |
32.1 |
0.5(3) |
2200 |
1500 |
1089 |
33.2 |
3.8(5) |
1300 |
1100 |
1978 |
39.0 |
0.9(4) |
10000 |
70000 |
2052 |
37.3 |
2.4(8) |
| 1,4-dichlorobenzene |
38.8 |
2700 |
300 |
2731 |
29.4 |
0.2(3) |
5200 |
3100 |
2856 |
32.8 |
1.9(5) |
6200 |
NA |
5995 |
38.8 |
1.8(4) |
NA |
7441 |
35.3 |
1.8(2) |
| naphthalene |
38.1 |
5800 |
600 |
6792 |
32.9 |
1.0(6) |
39000 |
22000 |
14472 |
34.9 |
1.2(5) |
13000 |
10000 |
17446 |
37.5 |
1.1(2) |
66000 |
34000 |
15875 |
36.0 |
2.5(7) |
a Bioconcentration factor for analyte (ng/kg leaf dry
weight to ng/L air) for 20 °C
b Enthalpy of vaporization at the compound boiling point from
ref 21
c BCF reported in ref 7
d BCF determined in this study
e One sigma deviation. The number of replicates to determine
DHPA are in parenthesis.
Value is blank for results based on one determination
f Not determined
| Table 4. Physical Properties for Volatile
and Semivolatile Compounds and their Enthalpy of Phase Change
between Air and Grass. |
| Compound |
Log BCFa
25 °C |
log KOAb
25 °C |
DHvapc
(kJ/mol) |
DHPAd
(kJ/mol) |
| benzene |
2.04 |
2.59 |
39.7 |
32.7 |
| tetrachloroethene |
2.17 |
2.61 |
38.0 |
31.9 |
| toluene |
2.28 |
3.17 |
33.8 |
32.7 |
| m,p-xylene |
2.36 |
3.65 |
42.2 |
32.1 |
| ethylbenzene |
2.25 |
3.59 |
49.0 |
33.6 |
| 1,4-dichlorobenzene |
3.29 |
4.03 |
42.5 |
29.4 |
| naphthalene |
3.63 |
4.21 |
54.2 |
32.9 |
| PCB 4 + 10e |
4.73 |
6.56 |
69.7 |
54.2 |
| PCB 8 + 5 |
4.92 |
6.98 |
72.2 |
65.4 |
| PCB 18 |
5.25 |
7.12 |
75.4 |
70.6 |
| PCB 16 + 32 |
5.46 |
7.18 |
75.4 |
64.5 |
| PCB 31 + 28 |
5.58 |
7.61 |
77.9 |
82.4 |
| PCB 52 |
5.86 |
7.73 |
80.8 |
86.6 |
| PCB 44 |
6.12 |
7.78 |
81.0 |
83.7 |
| PCB 71 + 64 |
6.08 |
7.89 |
81.0 |
90.0 |
| PCB 95 |
6.24 |
8.04 |
84.2 |
91.8 |
| PCB 84 + 90 + 101 |
6.54 |
8.23 |
85.8 |
97.8 |
| PCB 110 |
6.94 |
8.58 |
86.6 |
107.2 |
| PCB 149 |
7.01 |
8.68 |
89.8 |
108.9 |
| PCB 153 |
7.31 |
9.09 |
91.4 |
116.7 |
| PCB 158 + 138 |
7.59 |
9.15 |
92.1 |
123.3 |
| PCB 187 |
7.52 |
9.25 |
94.0 |
117.2 |
| PCB 180 |
8.11 |
9.72 |
96.5 |
128.8 |
| PCB 202 |
7.51 |
9.28 |
92.9 |
108.8 |
| PCB 203 + 196 |
8.33 |
9.91 |
100.4 |
137.5 |
a Bioconcentration factor for analyte (ug/kg leaf dry
weight to ug/L air). The first seven compound
values are from this study and the remainder from ref 10
b The first seven octanol air partition coefficients are from
ref 15. The remainder are from ref 10
c The first seven heat of vaporization values are from ref
21. The remainder are from ref 10
d The first seven enthalpy of phase change between air and
grass were from this study, the remainder
from ref 10
e IUPAC number
| Table 5. Predicted relative
concentrations of VOCs in pine and grass three hours after maximum
air concentrations under varying conditions. |
| - |
T |
wind |
Benzene |
toluene |
tetrachloroethene |
ethylbenzene |
m,p-xylene |
1,4-dichlorobenzene |
naphthalene |
| leaf |
(°C) |
(m s-1) |
Ia |
IIb |
I |
II |
I |
II |
I |
II |
I |
II |
I |
II |
I |
II |
| pine |
0 to 10 |
0.5 |
0.78 |
0.02 |
1.13 |
0.59 |
1.14 |
0.72 |
1.11 |
0.86 |
1.06 |
0.93 |
1.11 |
0.87 |
1.140 |
0.83 |
| |
0 to 10 |
1.0 |
0.74 |
0.00 |
1.09 |
0.48 |
1.14 |
0.63 |
1.13 |
0.81 |
1.08 |
0.90 |
1.13 |
0.82 |
1.16 |
0.77 |
| |
0 to 10 |
5.0 |
0.73 |
0.00 |
0.95 |
0.19 |
1.04 |
0.36 |
1.14 |
0.62 |
1.13 |
0.80 |
1.14 |
0.65 |
1.12 |
0.55 |
| |
20 to 30 |
0.5 |
0.75 |
0.00 |
0.96 |
0.20 |
1.04 |
0.35 |
1.13 |
0.60 |
1.13 |
0.78 |
1.14 |
0.63 |
1.11 |
0.54 |
| |
20 to 30 |
1.0 |
0.76 |
0.00 |
0.89 |
0.10 |
0.98 |
0.23 |
1.09 |
0.49 |
1.14 |
0.70 |
1.10 |
0.52 |
1.06 |
0.42 |
| |
20 to 30 |
5.0 |
0.78 |
0.00 |
0.77 |
0.01 |
0.82 |
0.04 |
0.96 |
0.20 |
1.08 |
0.45 |
0.96 |
0.23 |
0.89 |
0.14 |
| grass |
0 to 10 |
0.5 |
0.73 |
0.00 |
1.05 |
0.39 |
1.01 |
0.30 |
1.02 |
0.33 |
0.94 |
0.18 |
0.77 |
0.03 |
1.09 |
0.48 |
| |
0 to 10 |
1.0 |
0.73 |
0.00 |
0.99 |
0.27 |
0.94 |
0.18 |
0.95 |
0.21 |
0.87 |
0.09 |
0.72 |
0.01 |
1.02 |
0.36 |
| |
0 to 10 |
5.0 |
0.75 |
0.00 |
0.83 |
0.05 |
0.79 |
0.02 |
0.80 |
0.03 |
0.74 |
0.00 |
0.69 |
0.00 |
0.83 |
0.10 |
| |
20 to 30 |
0.5 |
0.77 |
0.00 |
0.86 |
0.06 |
0.82 |
0.03 |
0.82 |
0.04 |
0.77 |
0.01 |
0.71 |
0.00 |
0.87 |
0.12 |
| |
20 to 30 |
1.0 |
0.78 |
0.00 |
0.80 |
0.02 |
0.77 |
0.01 |
0.77 |
0.01 |
0.74 |
0.00 |
0.71 |
0.00 |
0.79 |
0.05 |
| |
20 to 30 |
5.0 |
0.79 |
0.00 |
0.74 |
0.00 |
0.74 |
0.00 |
0.73 |
0.00 |
0.73 |
0.00 |
0.73 |
0.00 |
0.68 |
0.00 |
a Concentration of analyte in air maximizes at 7:00 a.
m. and gradually minimizes to 1/10 of maximum concentration at noon.
The resultant value is the fraction of analyte that remains at 10:00
a. m.
b Concentration of analyte in air maximizes at 7:00 a. m.
and immediately becomes negligible. The resultant value is the fraction
of analyte that remains at 10:00 a. m.

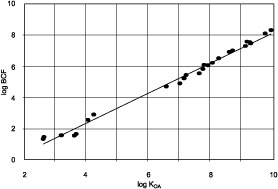
Figure 1. Log BCF at 20 °C vs log KOA at
25 °C for lipophilic compounds in grass.

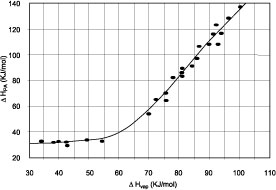
Figure 2. Log DHPA
vs DHvap for lipophilic compounds in grass.

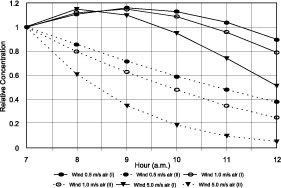
Figure 3. The effects of wind velocity on the concentration
of toluene in pine needles respective to its concentration
at 7:00 a.m. when the content of toluene in air is greatest.
The temperature increases from 0 to 10 °C over the 5-h period.
Air(I) is a trend where the toluene content in air steadily
decreases from a maximum at 7:00 a.m. to 1/10 maximum at noon.
Air(II) is a condition where after the 7:00 a.m. maximum the content
of toluene in air is negligible at 8:00 a.m.
|
![[logo] US EPA](../gif/logo_epaseal.gif)


