Bioconcentration Factors for Volatile Organic Compounds in Vegetation
| Table 1. Analytes and surrogates | ||||
| retention timea |
quantitation |
secondary |
relative volatility (aKoa)b |
|
| surrogates | - | - | ||
| benzene-d6 | 9.45 | 84 | 82,85 | 500 |
| fluorobenzene | 9.91 | 96 | 70 | 690 |
| 1,4-difluorobenzene | 10.06 | 114 | 63 | 860 |
| 1,2-dichloropropane | 10.78 | 67 | 69 | 98 |
| toluene-d8 | 13.02 | 98 | 100,99 | 2200 |
| 1,1,2-trichloroethane-d3 | 13.90 | 100 | 98 | 3800 |
| 1,2-dibromoethane-d4 | 15.44 | 111 | 113 | 5000 |
| chlorobenzene-d5 | 16.55 | 117 | 119,82 | 5800 |
| o-xylene-d10 | 17.81 | 98 | 116 | 8400 |
| 4-bromofluorobenzene | 19.72 | 174 | 176 | 13000 |
| bromobenzene-d5 | 20.05 | 161 | 163,82 | 12000 |
| 1,2-dichlorobenzene | 22.65 | 152 | 150 | 22000 |
| 1,2,4-trichlorobenzene | 24.75 | 183 | 185 | 41000 |
| naphthalene-d8 | 25.03 | 136 | 108 | 57000 |
| analytes | - | - | ||
| benzene | 9.45 | 78 | 77 | 460 |
| trichloroethene | 10.61 | 130 | 132 | 2600 |
| toluene | 13.18 | 91 | 92 | 2100 |
| tetrachloroethene | 14.6 | 166 | 164 | 6100 |
| ethylbenzene | 16.79 | 106 | 91 | 5000 |
| m,p-xylene | 16.97 | 106 | 91 | 4500 |
| o-xylene | 18.15 | 106 | 91 | 8200 |
| 1,2,4-trimethylbenzene | 21.24 | 120 | 105 | 16000 |
| 1,4-dichlorobenzene | 22.14 | 146 | 148 | 20000 |
| naphthalene | 25.07 | 128 | 108 | 41000 |
| monoterpenes | - | - | ||
| tricyclene | 18.15 | 93 | 91,136 | 7400 |
| a-pinene | 18.58 | 93 | 91,136 | 5600 |
| camphene | 19.45 | 93 | 91,136 | 11000 |
| b-pinene | 20.49 | 93 | 91,136 | 4800 |
| 3-carene | 21.23 | 93 | 91,136 | 6300 |
| a-terpinene | 21.39 | 93 | 91,136 | 8000 |
| limonene | 21.67 | 93 | 91,136 | 11000 |
| g-terpinene | 22.33 | 93 | 91,136 | 19000 |
a Retention times were determined using 60-m x 0.53-mm i.d.,
3.0-µm film thickness. Temperature program was: 3 min at 10 °C, 50
C/min ramp to 40 °C; 5 C/min ramp to 120 °C; 20 C/min to 220 °C and held
at 220 °C to end of run.
b Relative volatility values from reference 7. Relative volatilities
for monoterpenes were experimentally determined as part of this study.
| Table 2. Bioconcentration factors for selected leaves. | ||||||||||||||||
| dry wt (%) avg | Totala monoter- penes µg/ga avg |
toluene | tetrachloro- ethene |
ethyl- benzene |
m,r-xylene | 1,2,4-trimethyl- benzene | 1,4-dichloro- benzene | naphthalene | ||||||||
| plant | avg | dev | avg | dev | avg | dev | avg | dev | avg | dev | avg | dev | avg | dev | ||
| juniper | 40 | 1070. | 900 | 400 | 420 | 590 | 100000 | 54000 | 76000 | 47000 | NAb | NA | 280000 | 100000 | ||
| rosemary | 23 | 1000. | 14000 | 6000 | 5400 | 8100 | 1100 | 7000 | 10000 | 7000 | NA | NA | 66000 | 34000 | ||
| pine | 48 | 190. | 2300 | 1800 | 440 | 80 | 1800 | 1300 | 1300 | 1100 | 53000 | 29000 | 6200 | c | 13000 | 10000 |
| mock orange | 42 | 53. | 590 | 230 | 350 | 320 | 1600 | 900 | 2200 | 1500 | 110000 | 80000 | 5200 | 3100 | 39000 | 22000 |
| ivy | 37 | 3.9 | 190 | - | NA | NA | 290 | - | 9000 | - | 4000 | - | 8000 | - | ||
| holly | 43 | 3.1 | 220 | 180 | 210 | 210 | 260 | 290 | 230 | 160 | 1500 | 800 | 2300 | 1600 | 2900 | 1300 |
| grass | 20 | 0.6 | 200 | 70 | 220 | 190 | 350 | 240 | 420 | 200 | 1800 | 900 | 2700 | 300 | 5800 | 2600 |
| olive | 52 | 0.1 | 180 | 70 | 350 | 180 | 330 | 100 | 230 | 160 | 800 | 430 | 800 | - | 1400 | 600 |
a Concentrations determined as described in this study
b Concentration of analyte in leaves could not be determined.
c Only one determination
| Table 3. The ratios of BCF to Koa and P values for VOCs in leaves | |||||||||||
| BCF/Koa |
R |
||||||||||
| toluene | PCE | ethyl- benzene |
m,r-xylene | 1,2,4-trimethyl- benzene |
1,4-dichloro- benzene |
naphtha lene |
avg | dev |
avg |
dev | |
| juniper | .47 | .87 | 19.8 | 13.1 | NAb | NA | 10.6 | 9.0 | 8.3 | 6.3 | 8.0 |
| rosemary | 7.64 | 16.8 | 2.1 | 1.8 | NA | NA | 2.55 | 6.2 | 6.4 | 4.3 | 6.0 |
| pine | 1.2 | .91 | .35 | .22 | NA | .41 | .50 | .60 | .38 | .43 | .39 |
| mock orange | .31 | .72 | .30 | .37 | NA | .35 | .85 | .48 | .24 | .35 | .28 |
| ivy | .10 | NA | NA | .05 | .49 | .25 | .32 | .24 | .18 | .15 | .16 |
| holly | .12 | .45 | .05 | .04 | .08 | .15 | .11 | .14 | .14 | .06 | .13 |
| grass | .11 | .46 | .07 | .07 | .09 | .18 | .22 | .17 | .14 | .08 | .13 |
| olive | .09 | .73 | .06 | .05 | .04 | .05 | .05 | .15 | .25 | .09 | .24 |
| Koaa | 1900 | 480 | 5100 | 5800 | 19000 | 15000 | 26000 | ||||
a Koa values taken from reference 7.
b concentration of analyte in leaves could not be determined.
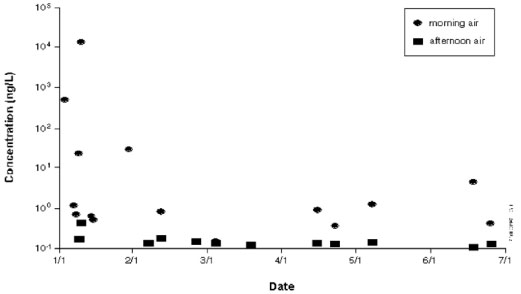
Figure 1. Concentrations of toluene in morning and afternoon air samples.
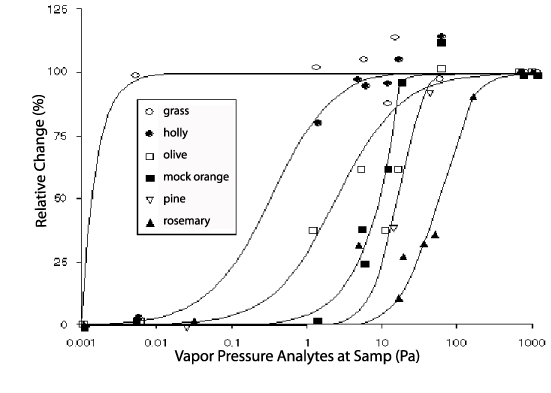
Figure 2. Comparison of VOC concentrations in leaves varying with daily changes in air concentration as a function of analyte vapor pressure during sampling.
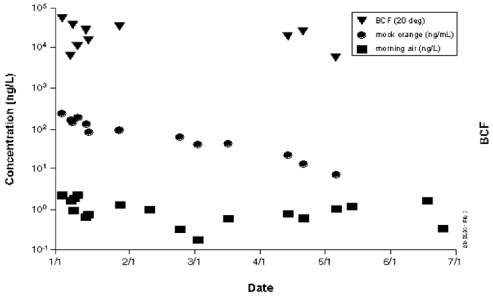
Figure 3. Concentration of naphthalene in mock orange and air with calculated BCEs.