Water: Middle School
Exercise II. Stream Discharge
Vocabulary
Before you begin this exercise, take a minute to write down the definitions of these terms.Stream discharge:
Velocity:
Cross-sectional area:
On your watershed page (http://cfpub.epa.gov/surf/locate/index.cfm), click on "Search by Map" and click on your state. Scroll down under the "State profile" title, to the subtitle called: "Information provided by the United States Geological Survey (USGS)."
Look for the link called "Real-time Streamflow data" and click on it.
This link takes you to a USGS Web page where you can view graphs of stream-flow information for streams in your area.
Part A
Locate your river basin (it should be a bold subtitle such as "James River Basin" or "York River Basin")
Find a familiar location, or check with your teacher to find a location close to you. Click on the 8-digit number next to the gauge site near you. (There should a short description such as, "Madison River near West Yellowstone MT" or "WIND RIVER NEAR DUBOIS, WYO")
This page lets you make a graph of discharge from the stream. Under "Available Parameters" select "Discharge." Under "Output" select "Graph." Under "Days" change the number of days to 30 by typing the number into the box provided. Usually a graph can be provided for information collected for the previous 31 days.
Check out the option to download a presentation-quality graph.
Print out a presentation-quality graph from the Web site.
1. Does the graph have any sharp increases or decreases? What might these mean?
2. Does the graph have gradual increases or decreases? What might these mean?
Part B
Repeat the steps in part A but this time choose a gage location upstream or downstream (on the same river) from the first gage location. Print out a presentation-quality graph for this gage also. Compare the two graphs.
3. Do you see any relationship between increases and decreases in water flow on the two graphs?

Part C
Identify a small stream that leads to your river (or identify a larger river that is downstream of you). Print out a discharge volume graph for this river and compare it with your graph from part A.
4. Which graph shows a larger discharge?
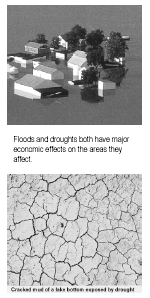
5. Can you find anything on your graph that might indicate that a drought or a flood has taken place?
Part D
Return to the "Surf Your Watershed" page for your watershed. Just below the Stream Flow link is a Water Use link. Click on this link to see a listing of water withdrawals and returns from various sources.
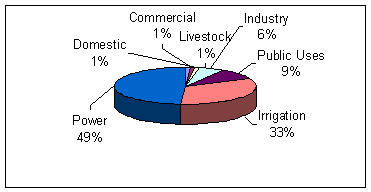
Uses of Fresh Surface Water in the United States 
6. In your watershed, what water use withdraws most of the water?
7. In your watershed, what water uses return water that could possibly contain pollutants?
8. Look at the water use data for watersheds upstream and downstream from where you live. How do water uses upstream and downstream of the river differ?
9. How can water use upstream affect water use downstream?

The average person in the United States uses 70 gallons of water per day. Usually 2.5 quarts of that water is for drinking.
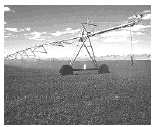
The United States uses 100 billion gallons of water per day to irrigate crops.

Middle Schools | Whatzzzup_Stream? | Exercises: I | II | III | IV | V | VI | Top
