Assessing Outdoor Air Near Schools
Sunnyside Elementary School - Durango, CO
Results and Analysis of EPA’s monitoring
EPA selected this school for monitoring in consultation with the Southern Ute Indian Tribe Air Quality Program because it is located near oil and natural gas exploration and production activities which are sources of air toxics emissions. There was interest in evaluating the ambient concentrations of benzene in air outside the school, and prompted EPA to test to see if the levels present may be of concern.
| Primary Findings | Measured levels of benzene and associated longer-term concentration estimates are not as high as suggested by the information available prior to monitoring. Although they were below the levels of significant concern that had been suggested by the information available prior to sampling, these results indicate the influence of pollutants of concern that are the focus of EPA actions nationwide. |
| Key Pollutants Monitored | Benzene. Inhalation of benzene at high levels can affect the bone marrow and can cause anemia and leukemia. |
| Next Steps | Based on the analysis described here, EPA will not extend air toxics monitoring at Sunnyside Elementary School. EPA remains concerned about nationwide emissions from sources of air toxics and continues to work to reduce those emissions across the country, through national rules and by providing information and suggestions to assist with air pollution reductions in local areas. The Southern Ute Indian Tribe (SUIT) Air Quality Program (AQP) will continue to monitor for criteria pollutants (ozone, NO/NO2/NOx, and PM2.5) at the nearby SUIT AQP monitoring site, Ute 3. The Ute 3 site is approximately 1.5 miles away from Sunnyside Elementary School. |
Summary of Study Approach and Findings
Approach:
- A monitor collected air samples from September 4, 2009 through November 9, 2009 at Sunnyside Elementary School in Durango, CO.
- We posted individual air sample results on this website throughout the monitoring period to keep your community informed during the monitoring period.
- During the monitoring period, we evaluated the monitored concentrations to see if there was a concern from short-term exposures (e.g., several weeks).
- When the monitoring was complete, we analyzed the results to see if there was a concern from long-term exposures (over a lifetime).
- Also, when the monitoring was complete, we evaluated all the air samples from the on-site monitor. We also evaluated information on wind speed and wind direction from a weather monitor at the school, along with historical weather information and information about nearby sources of benzene emissions.
Findings:
- Levels of benzene were not as high as was suggested by information available prior to monitoring and are below the levels of significant concern that had been suggested by the information available prior to sampling.
- The concentrations of benzene measured at the school are lower than those suggested by the information that helped identify this school for monitoring.
- The process to identify schools for monitoring relied on emissions estimates and other information. Ambient air monitoring at the school allowed measurement of what was actually in the air.
- The nearby oil and natural gas exploration and production activities were operating at typical capacity during the monitoring period.
- Based on the analysis described here, EPA will not extend air toxics monitoring at Sunnyside Elementary School.
- Click here for additional information
How We Analyzed the Information We Collected at this School
The analysis considered whether the information collected at the school might raise concerns for the health of children or adults at the school. We looked at the following types of information:
- Measured benzeneconcentrations and information on benzene
- Measured wind direction and wind speed at the school
- Information about nearby sources of benzeneemissions
Analysis of Measured Benzene Concentrations:
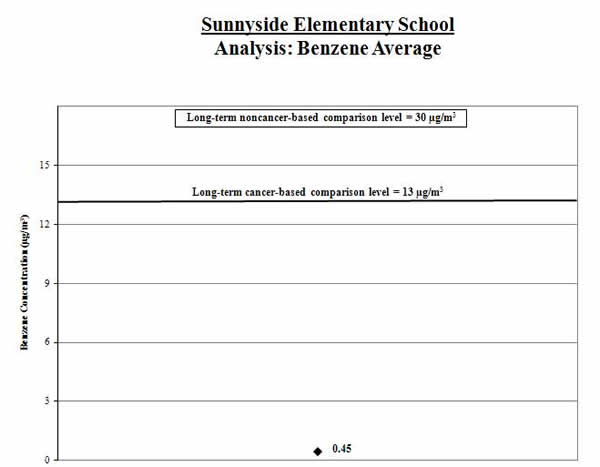
1. Calculate the average: We calculated the average of the benzene measurements (shown by the black diamond in the graph below). We compared this average to the long-term comparison levels (thick line on the graph below).
Result: The average benzene level for the samples collected was below the long-term comparison levels.
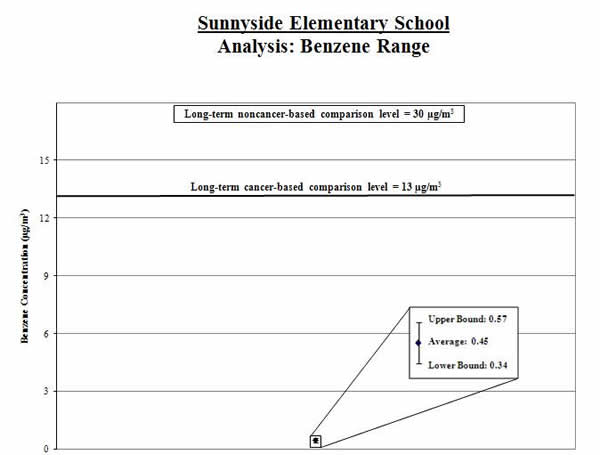
2. Calculate a range: To account for varying air concentrations of benzene, we calculated a range around the average. We did this by estimating high and low values that the longer-term concentrations might reach using common statistical tools. We compared the highest point in the range (called the “upper bound”) to the long-term comparison levels.
Result: The high end of the range is lower than the comparison levels.
Analysis of Measured Wind Direction and Wind Speed at the School
We took measurements of wind direction and speed every day during the sample period. We took special note of the wind speed and direction on the days we took measurements of benzene.
| What we looked at | What we found |
| We looked at whether the wind data taken on the days we took measurements of benzene are similar or different from the wind patterns during the entire sampling period. | We found the wind patterns taken on the days we took measurements of benzene to be similar to those observed during the entire sampling period. |
| We looked at whether the wind pattern during the sampling period is reflective of regional wind pattern over the long term. | Although we lack long-term wind data at the monitoring site, the wind pattern at the NWS station during the sampling period is similar to the historical long-term wind flow pattern at that same NWS station. Therefore, the 2-month sampling period may be representative of year-round wind patterns. |
Analysis of Information on Nearby Sources of Benzene Emissions
| What we looked at | What we found |
| Whether we could determine if the sources were operating as usual during the sampling period. | The nearby oil and natural gas exploration and production activities were operating at typical capacity during monitoring. |
The concentrations of benzene measured at the school are lower than those suggested by the information that helped identify this school for monitoring. However, this is an active energy production area with increased oil and natural gas drilling, thus the potential health impacts could vary in the future. |
|
| The emissions inventory for these sources of air pollution is not well characterized; therefore, the understanding of the impacts could change with additional information. |
Additional Information
Technical Report for School: Assessing Outdoor Air Near Schools: Sunnyside Elementary School (Durango, CO) (PDF) (26pp, 180k). The technical report is geared toward risk assessors, risk managers, and other regulatory agencies.
Background on School Monitoring Effort