Assessing Outdoor Air Near Schools
San Jacinto Elementary School and Deer Park Junior High School - Deer Park, TX
- Understanding the Monitoring Data
- Initial Sample Results
- Initial Analysis
- Additional Sample Results
- Final Analysis
Results and Analysis of EPA’s monitoring
EPA selected these schools for monitoring because they are located near a large petrochemical complex, as well as other industries which are sources of air toxics emissions. For the purposes of this study, results from the air monitoring at San Jacinto Elementary School are considered to be indicative of conditions at the nearby Deer Park Junior High School. Air monitoring was initially conducted at San Jacinto Elementary School from September 4, 2009 to January 11, 2010 to assess concentrations of 1,3-butadiene, benzene, and other volatile organic compounds (VOCs); and benzo(a)pyrene and other polycyclic aromatic hydrocarbons (PAH) in the air. EPA extended air toxics monitoring at this school, because measurements of 1,3-butadiene including one elevated result indicated a potential concern for long-term, continuous exposure. Additional monitoring for 1,3-butadiene, benzene, and other VOCs were conducted from October 13, 2011 to May 28, 2012.
| Primary Findings | Measured values of 1,3-butadiene and benzene indicate influence of the source at this school location. However, results of 1,3-butadiene, benzene, and other VOCs are below levels of significant concern. |
| Key Pollutants Monitored | 1,3-Butadiene. Inhalation may affect the reproductive system or cause leukemia if people are exposed to high levels. Benzene. Inhalation of benzene at high levels can affect the bone marrow and can cause anemia and leukemia. |
| Next Steps | Based on the analysis described here, EPA will not extend air toxics monitoring at this location. EPA remains concerned about emissions from sources of air toxics and continues to work to reduce those emissions across the country, through national rules and by providing information and suggestions to assist with reductions in local areas. The Texas Commission on Environmental Quality (TCEQ) will continue to oversee industrial facilities in the area through clean air regulatory programs. TCEQ has developed air monitoring comparison values which can be found at http://www.tceq.texas.gov/toxicology/AirToxics.html. |
Summary of Study Approach and Findings
Approach:
- A monitor collected air samples from October 13, 2011 through May 28, 2012 at San Jacinto Elementary School in Deer Park, TX.
- Individual air sample results are posted on this website.
- When the monitoring was complete, we analyzed the results to see if there was a concern from long-term concentrations (over a lifetime).
- Also, when the monitoring was complete, we evaluated all the air samples from the on-site monitor. We also evaluated information on wind speed and wind direction from a weather monitor at the school, along with historical weather information and information about nearby sources of 1,3-butadiene and benzene emissions.
Findings:
- Measured values of 1,3-butadiene, benzene, and other VOCs indicate an influence of the source at this school. Concentrations of 1,3-butadiene, benzene, and VOCs are similar to those typically measured at a nearby NATTS monitoring site less than 3 miles to the south of the school.
- Levels of 1,3-butadiene and benzene are below levels of concern for short-term and long-term exposure.
- The refinery’s process units that handle, produce or process high concentration benzene streams were all operating in normal production mode. Some units within the chemical plant were down briefly (about 4 weeks) at the beginning of monitoring. The most recently available 1,3-butadiene and benzene emissions data for this source (2011 TRI) are lower to those relied upon in the previous modeling analysis for this area (2002 NATA, 2005 TRI).
- Based on these findings, EPA will not extend air toxics monitoring at the San Jacinto Elementary School.
- Click here for additional information
How We Analyzed the Information We Collected at this School
The analysis considered whether the information collected at the school might raise concerns for the health of children or adults at the school. We looked at the following types of information:
- Measured concentrations and information on 1,3-butadiene and benzene
- Measured wind direction and wind speed at the school
- Information about nearby sources of 1,3-butadiene and benzene emissions
Analysis of Measured 1,3-Butadiene Concentrations:
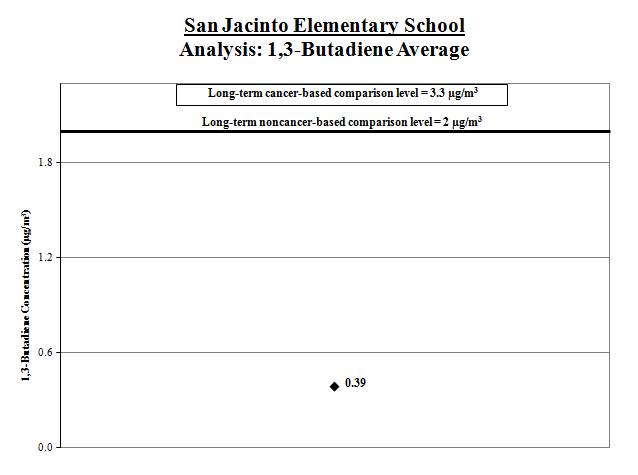
1. Calculate the average: We calculated the average of the 1,3-butadiene measurements (shown by the black diamond in the graph below). We compared this average to the long-term comparison level (thick line on the graph below).
Result: The average 1,3-butadiene level for the samples collected was below the long-term comparison level.
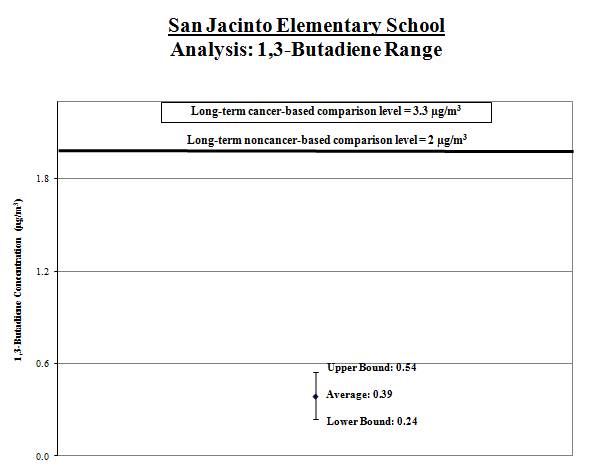
2. Calculate a range: To account for varying air concentrations of 1,3-butadiene, we calculated a range around the average. We did this by estimating high and low values that the longer-term concentrations might reach using common statistical tools. We compared the highest point in the range (called the “upper bound”) to the long-term comparison level.
Result: The high end of the range is lower than the comparison level.
Analysis of Measured Benzene Concentrations:
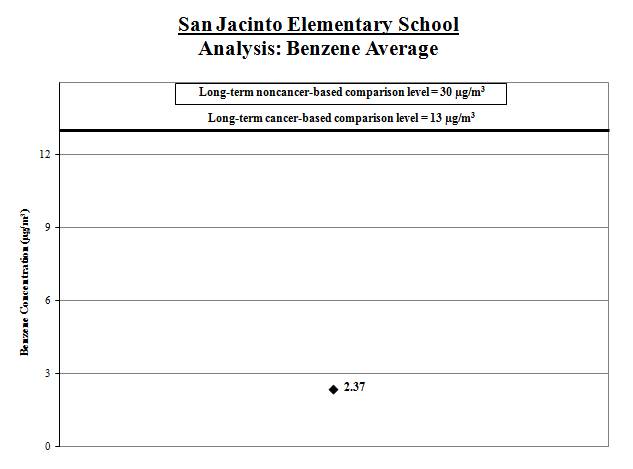
1. Calculate the average: We calculated the average of the benzene measurements (shown by the black diamond in the graph below). We compared this average to the long-term comparison level (thick line on the graph below).
Result: The average benzene level for the samples collected was below the long-term comparison level.
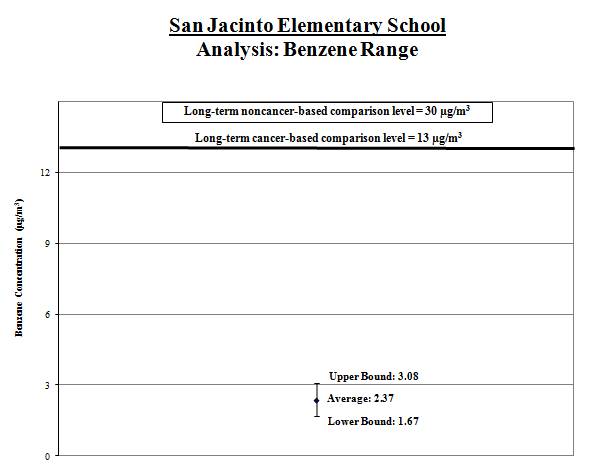
2. Calculate a range: To account for varying air concentrations of benzene, we calculated a range around the average. We did this by estimating high and low values that the longer-term concentrations might reach using common statistical tools. We compared the highest point in the range (called the “upper bound”) to the long-term comparison level.
Result: The high end of the range is lower than the comparison level.
Analysis of Measured Wind Direction and Wind Speed at the School
We took measurements of wind direction and speed every day during the sample period. We took special note of the wind speed and direction on the days we took measurements.
| What we looked at | What we found |
| We looked at whether the wind data taken on the days we took measurements of are similar or different from the wind patterns during the entire sampling period. | We found the wind patterns taken on the days we took measurements to be similar to those observed during the entire sampling period. |
| We looked at whether the wind pattern during the sampling period is reflective of regional wind pattern over the long term. | The historical data from the National Weather Service (NWS) station indicates that winds are predominantly from the south-southeast with a smaller percentage of winds from the north, which is similar to met data from the school site. |
Analysis of Information on Nearby Source of 1,3-Butadiene and Benzene Emissions
| What we looked at | What we found |
| Whether we could determine if the source was operating as usual during the sampling period | The refinery’s process units that handle, produce or process high concentration benzene streams were all operating in normal production mode. Some units within the chemical plant were down briefly (about 4 weeks) at the beginning of sampling. The most recently available 1,3-butadiene and benzene emissions data for this source (2011 TRI) are lower to those relied upon in the previous modeling analysis for this area (2002 NATA, 2005 TRI). |
The nearby industrial source of 1,3-butadiene and benzene has permits issued by TCEQ that includes operating requirements. |
Additional Information
Technical Report for School: Assessing Outdoor Air Near Schools: Additional Monitoring at San Jacinto Elementary School and Deer Park Junior High School (Deer Park, TX) (PDF) (30 pp,38k). The technical report is a follow-up to the original monitoring which took place September 2009 to January 2010. The report is geared toward risk assessors, risk managers, and other regulatory agencies.
Background on School Monitoring Effort
General Questions and Answers for School Monitoring Effort