Assessing Outdoor Air Near Schools
Lapwai High School - Lapwai, ID
Results and Analysis of EPA’s monitoring
EPA selected this school for monitoring in consultation with the Nez Perce Indian Tribe because it is located near a highway which is a source of air toxics emissions. Acetaldehyde, benzene and 1,3-butadiene could be present in the air around the school due to the presence of mobile sources such as cars and other motor vehicles and off-road machinery which prompted EPA to test to see if the levels present may be of concern.
| Primary Findings | Levels of acetaldehyde, benzene and 1,3-butadiene in the air at the school were not as high as was suggested by information available prior to monitoring and are below the levels of concern. However, these results indicate the influence of mobile source pollutants of concern that are the focus of EPA actions nationwide. |
| Key Pollutants Monitored | Acetaldehyde. Exposure to high levels can cause irritation of the eyes, skin and upper respiratory tract. |
| Next Steps | Based on the analysis described here, EPA will not extend air toxics monitoring at Lapwai High School. EPA remains concerned about nationwide emissions from sources of air toxics and continues to work to reduce those emissions across the country, through national rules and by providing information and suggestions to assist with air pollution reductions in local areas. The Nez Perce Tribe’s ERWM Air Quality Program has identified two priority areas for further study. The first is to monitor during warm summer months using real time PTR-MS to quantify aldehyde precursors from biogenic and anthropogenic sources to identify contributions to elevated summer carbonyl concentrations. A second priority is to quantify concentrations during inversion events. Results will add to the understanding of atmospheric aldehyde chemistry. |
Summary of Study Approach and Findings
Approach:
- A monitor collected air samples from September 16, 2009 through December 9, 2009 at Lapwai High School in Lapwai, ID.
- We posted individual air sample results on this website throughout the monitoring period to keep your community informed during the monitoring period.
- During the monitoring period, we evaluated the monitored concentrations to see if there was a concern from short-term exposures (e.g., several weeks).
- When the monitoring was complete, we analyzed the results to see if there was a concern from long-term exposures (over a lifetime).
- Also, when the monitoring was complete, we evaluated all the air samples from the on-site monitor. We also evaluated information on wind speed and wind direction from a weather monitor at the school, along with historical weather information and information about nearby sources of benzene emissions.
Findings:
- Levels of acetaldehyde, benzene, and 1,3-butadiene were not as high as was suggested by information available prior to monitoring and are below the levels of significant concern.
- The concentrations of acetaldehyde, benzene, and 1,3-butadiene measured at the school are lower than those suggested by the information that helped identify this school for monitoring.
- The process to identify schools for monitoring relied on emissions estimates and other information. Ambient air monitoring at the school allowed measurement of what was actually in the air.
- The most recently available acetaldehyde, benzene, and 1,3-butadiene emissions estimates for the nearby facility from the 2005 National-Scale Air Toxics Assessment (NATA) arelower than the estimates used to identify this school for monitoring.
- In a year-long EPA Community-Scale Air Toxics Monitoring study conducted by the Nez Perce Tribe during 2006-2007, the acetaldehyde and formaldehyde concentrations exhibited a seasonal pattern reflecting air temperature and were probably related to secondary formation during warm summer months. Since the SAT sampling occurred during the winter period, the SAT sampling may under-estimate the ambient concentrations of acetaldehyde and formaldehyde during other times of the year in Lapwai.
- Based on the analysis described here, EPA will not extend air toxics monitoring at Lapwai High School.
- Click here for additional information
How We Analyzed the Information We Collected at this School
The analysis considered whether the information collected at the school might raise concerns for the health of children or adults at the school. We looked at the following types of information:
- Measured acetaldehyde, benzene, and 1,3-butadieneconcentrations and information on acetaldehyde, benzene, and 1,3-butadiene
- Measured wind direction and wind speed at the school
- Information about nearby sources of acetaldehyde, benzene, and 1,3-butadieneemissions
Analysis of Measured Acetaldehyde Concentrations:
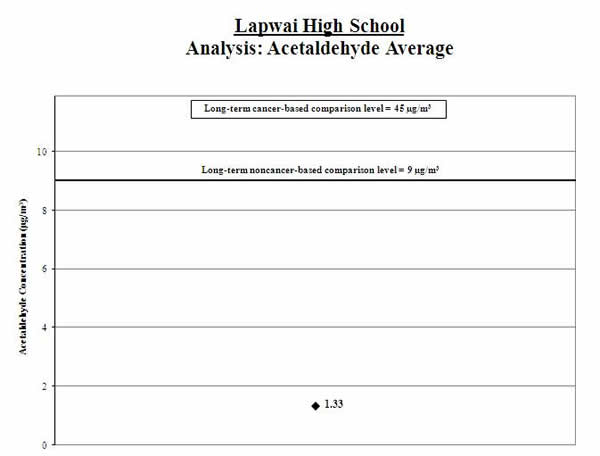
1. Calculate the average: We calculated the average of the acetaldehyde measurements (shown by the black diamond in the graph below). We compared this average to the long-term comparison levels (see thick line on the graph below).
Result: The average acetaldehyde level for the samples collected was below the long-term comparison levels.
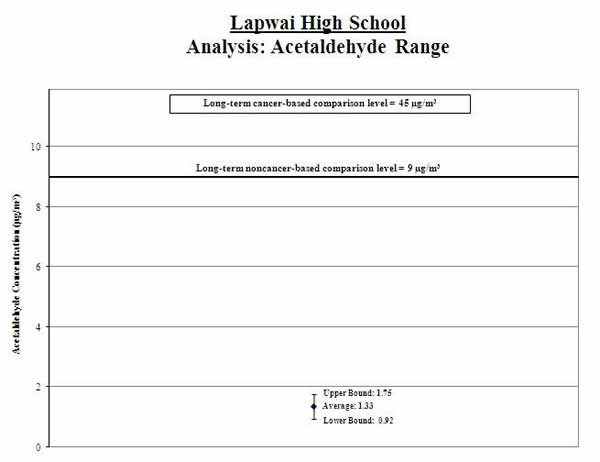
2. Calculate a range: To account for varying air concentrations of acetaldehyde, we calculated a range around the average. We did this by estimating high and low values that the longer-term concentrations might reach using common statistical tools. We compared the highest point in the range (called the “upper bound”) to the long-term comparison levels.
Result: The high end of the range is lower than the comparison levels.
Analysis of Measured Benzene Concentrations:
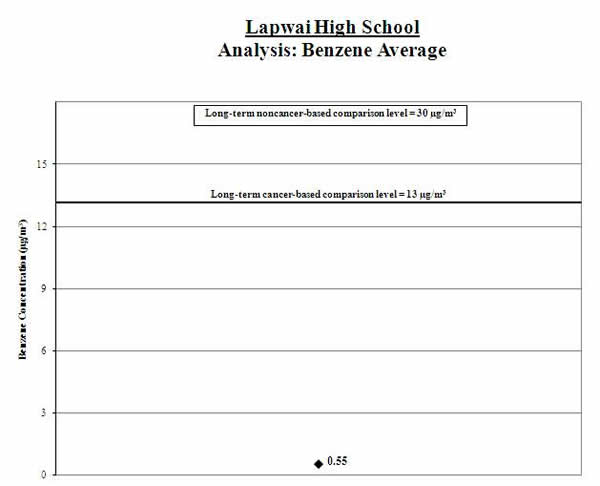
1. Calculate the average: We calculated the average of the benzene measurements (shown by the black diamond in the graph below). We compared this average to the long-term comparison levels (see thick line on the graph below).
Result: The average benzene level for the samples collected was below the long-term comparison levels.
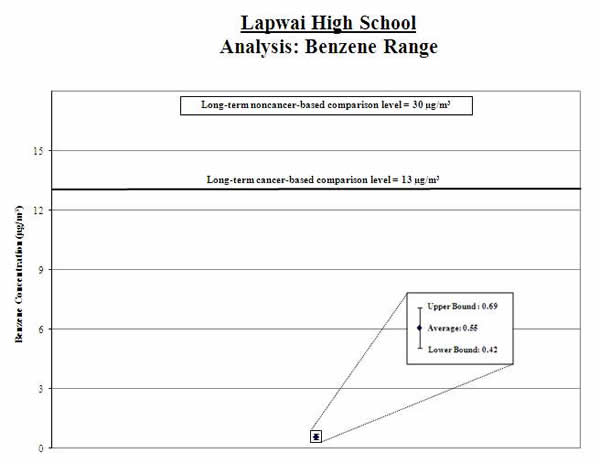
2. Calculate a range: To account for varying air concentrations of benzene, we calculated a range around the average. We did this by estimating high and low values that the longer-term concentrations might reach using common statistical tools. We compared the highest point in the range (called the “upper bound”) to the long-term comparison levels.
Result: The high end of the range is lower than the comparison levels.
Analysis of Measured 1,3-Butadiene Concentrations:
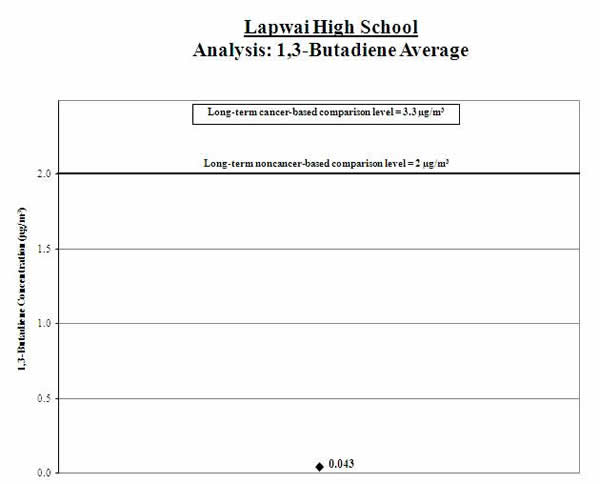
1. Calculate the average: We calculated the average of the 1,3-butadiene measurements (shown by the black diamond in the graph below). We compared this average to the long-term comparison levels (see thick line on the graph below).
Result: The average 1,3-butadiene level for the samples collected was below the long-term comparison levels.
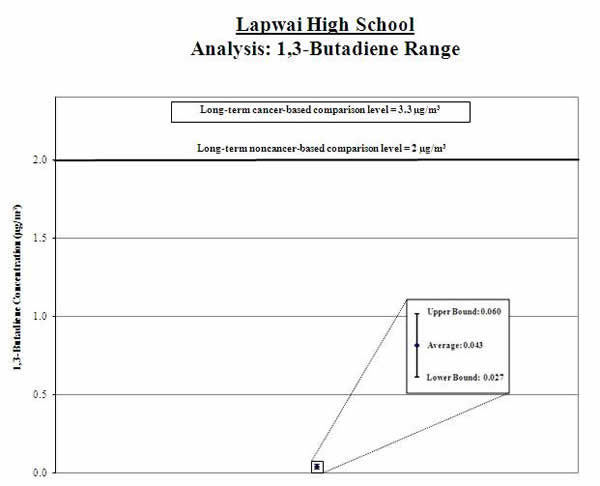
2. Calculate a range: To account for varying air concentrations of 1,3-butadiene, we calculated a range around the average. We did this by estimating high and low values that the longer-term concentrations might reach using common statistical tools. We compared the highest point in the range (called the “upper bound”) to the long-term comparison levels.
Result: The high end of the range is lower than the comparison levels.
Analysis of Measured Wind Direction and Wind Speed at the School
We took measurements of wind direction and speed every day during the sample period. We took special note of the wind speed and direction on the days we took measurements of benzene.
| What we looked at | What we found |
| We looked at whether the wind data taken on the days we took measurements of acetaldehyde, benzene, and 1,3-butadiene are similar or different from the wind patterns during the entire sampling period. | We found the wind patterns taken on the days we took measurements of acetaldehyde, benzene, and 1,3-butadiene to be similar to those observed during the entire sampling period. |
| We looked at whether the wind pattern during the sampling period is reflective of regional wind pattern over the long term. | Although we lack long-term wind data at the monitoring site, the wind pattern at the Lapwai meteorological station during the sampling period is similar to the historical long-term wind flow pattern at that same station. Therefore, the 3-month sampling period may be representative of year-round wind patterns. |
Analysis of Information on Nearby Sources of Acetaldehyde, Benzene, and 1,3-Butadiene Emissions
| What we looked at | What we found |
| Whether we could determine if the sources were operating as usual during the sampling period. | There were no disruptions in typical roadway activity during the sampling period. |
The concentrations of acetaldehyde, benzene, and 1,3-butadiene measured at the school are lower than those suggested by the information that helped identify this school for monitoring. |
|
| EPA’s ongoing research and national air toxics monitoring programs will continue to collect information on mobile source impacts on outdoor air nationally. |
Additional Information
Technical Report for School: Assessing Outdoor Air Near Schools: Lapwai High School (Lapwai, ID) (PDF) (37pp, 494k). The technical report is geared toward risk assessors, risk managers, and other regulatory agencies.
Background on School Monitoring Effort