Air Data
EPA air sampling data
Air samples for oil-related volatile organic compounds (VOCs)
Sample data from July 28 - August 27, 2010
(8- hour SUMMA, 24-hour SUMMA, and Tedlar bag sampling)
Posted September 8, 2010
- Enbridge Oil Spill Air Samples for
oil related compounds
(PDF) (138pp, 368K About PDF) - Enbridge Oil Spill Air Samples for oil related compounds (CSV) (575K)
- View EPA air sampling and air monitoring locations in Google Earth (.kmz file) from July 26, 2010 to Oct. 27, 2010
- Follow these steps to refresh Google Earth layers, icons, and data (PDF) (1 pg, 73K) Feb. 20, 2014
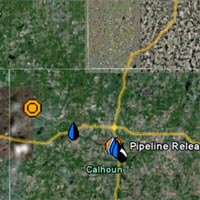
- Sampling locations on an interactive map are linked to sampling data.
- The Google Earth information regarding the Enbridge oil spill response now includes a highlighted area where the Unified Command is working, the operational division boundaries, and more significant landmark information.
- If you don't have Google Earth installed on your computer, you can get the free download here.

Understanding EPA's air data
EPA is overseeing Enbridge’s sampling and monitoring efforts. The tools being used provide information about the levels of chemicals in the air. To evaluate the chemical monitoring information, public health scientists compare air sampling results to health-based screening concentrations (also called “screening levels”). These screening levels are developed from health effects information about each volatile organic chemical (VOC). Screening levels assume a person is breathing a pollutant continuously (24 hours a day, seven days a week) for as long as one year. The screening levels are considered protective for up to one year of exposure. They are based on various criteria and some of the values are protective for durations longer than one year.
Enbridge VOC screening levels (PDF) (2pp, 63K) August 13, 2010