Contact EPA Pacific Southwest Water Division
Pacific Southwest, Region 9
Serving: Arizona, California, Hawaii, Nevada, Pacific Islands, Tribal Nations
Newport Bay Watershed
On this page:
Partners & Contact Info
Santa Ana Regional Water Quality Control Board ![]() is the California regional water quality agency responsible for implementing the federal Clean Water Act as well as state water quality regulations.
is the California regional water quality agency responsible for implementing the federal Clean Water Act as well as state water quality regulations.
Contacts
Doug Shibberu (Dshibberu@
waterboards.ca.gov)
Environmental Scientist
Santa Ana Regional Water Quality Control Board
(951) 782-7959
Tina Yin (yin.christina@epa.gov)
Regional NPS Coordinator
US EPA Region 9
(415) 972-3579
The Watershed
Newport Bay is located in the central portion of Orange County, California. The Newport Bay Watershed (PDF) (1 pp, 347K) is defined by the foothills of the Santa Ana Mountains to the east (Loma Ridge), and the San Joaquin Hills to the west and southwest. The total area of the Newport Bay watershed (PDF) (1 pp, 347K) is approximately 154 square miles (98,500 acres). There are 4 sub-watersheds at 12 digit HUC (hydrologic unit code) scale that make up the Greater Newport Bay Watershed: Peters Canyon Wash (PDF) (1 pp, 338K), Upper San Diego Creek, Lower San Diego Creek (PDF) (1 pp, 229K), and Newport Bay (PDF) (1 pp, 231K).
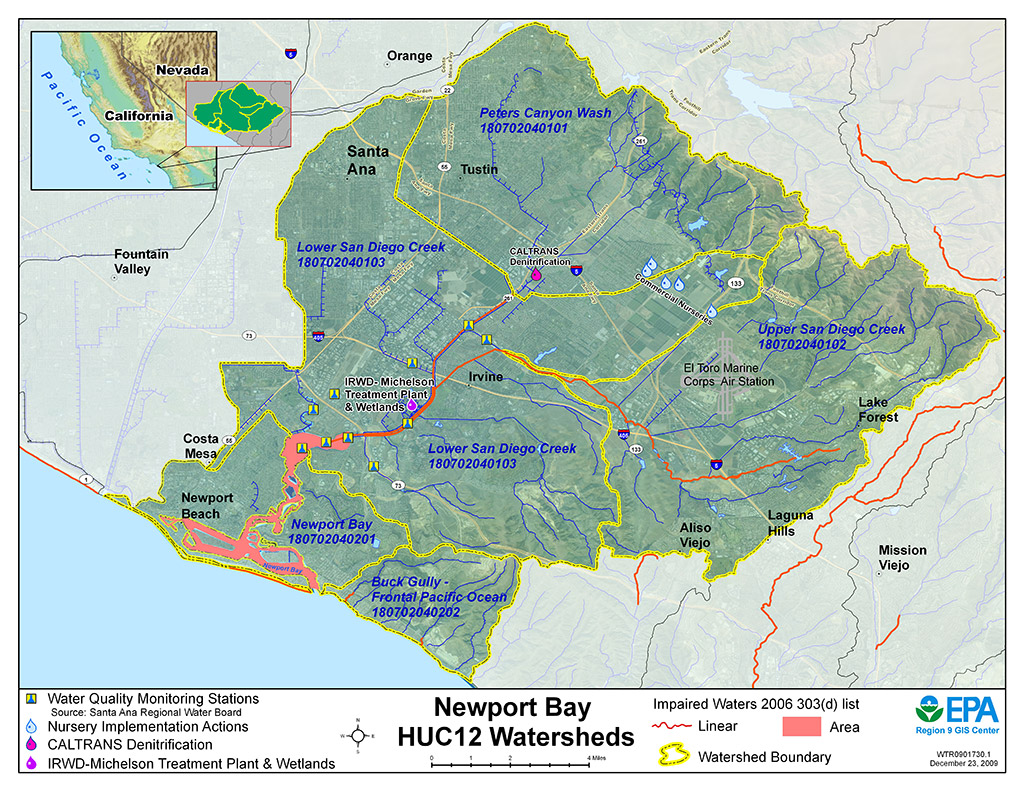
The watershed is highly urbanized and also has some agriculture (row crops - strawberries, avocados, lemons and commercial nurseries). Nine cities are located partly or fully within the watershed: Costa Mesa, Irvine, Lake Forest, Laguna Hills, Laguna Woods, Newport Beach, Orange, Santa Ana, and Tustin. The watershed also includes several unincorporated areas of Orange County. The total estimated population within the watershed is 640,000.
Water quality in the Newport Bay watersheds is currently listed by the State of California as impaired by many different pollutants including pesticides such as chlordane and toxaphene, DDT, Nutrients, Sediment and Siltation, copper and other metals, fecal coliform, pathogens, PCBs, sediment toxicity and selenium (California 2006 303(d) List of Impaired Waters (PDF) (299 pp, 1.1M) ![]()
Progress and Environmental Results
Full Report Documenting Watershed Wide Improvement (EPA Strategic Measure SP12):
Reducing nutrient loads and excessive algae blooms in the Newport Bay Watersheds, Orange County, California (PDF) (14 pp, 2.1M)
EPA is tracking progress to restore watersheds and water quality throughout the nation (see EPA National Water Program Strategic Plan and Guidance). One measure of progress is where improved water quality conditions in impaired watersheds have been achieved by implementing a watershed approach (see: SP-12).
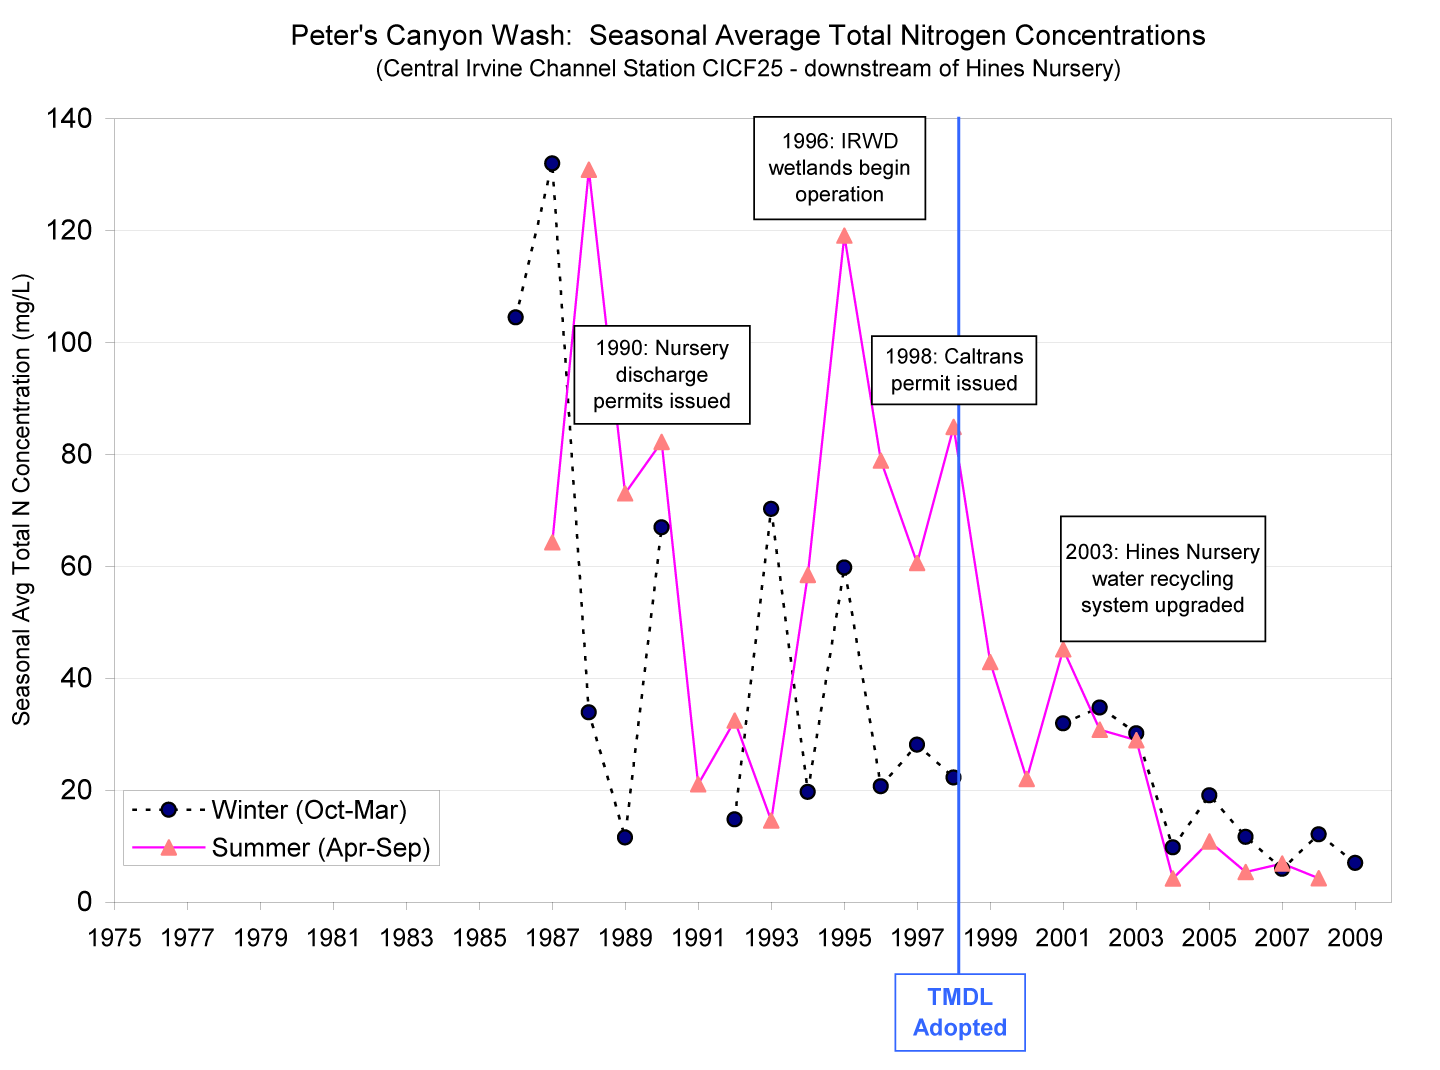
Under this measure (SP12), in 2010, EPA and the Santa Ana Regional Water Board produced a report to document the successful efforts to achieve significant reductions in nutrient levels in two sub-watersheds of Newport Bay.
While continued efforts are needed to fully restore beneficial uses of Newport Bay watersheds and reduce all pollutant loads, the success of the watershed approach to reduce nutrients can be used as a model for future implementation. EPA recognizes success will involve a watershed approach relying on both regulatory and non-regulatory mechanisms.
Reducing Nutrients
Two Newport Bay watersheds show watershed-wide improvement for nutrient impairments to water quality. Nutrient load reductions were achieved using a watershed approach that included both regulatory and non-regulatory mechanisms. These mechanisms were targeted to the three primary sources of nutrients in the watersheds: agriculture, urban runoff and large commercial nursery operations. Water quality data show total nitrogen concentrations have been reduced from highs of 140 mg/L recorded in the 1980s down to less than 10 mg/L today. Biological indicators of watershed health have also shown improvement including reduced algal blooms and increased eel grass populations.

Maps
Newport Bay Watershed Maps
- Greater Newport Bay Watersheds (PDF) (1 pp, 347K)
- Peters Canyon Wash (PDF) (1 pp, 338K)
- Lower San Diego Creek (PDF) (1 pp, 229K)
- Newport Bay (PDF) (1 pp, 231K)