Public Involvement Network News
Note: EPA no longer updates this information, but it may be useful as a reference or resource.
Maps to illustrate Engaging Coastal North Carolinians on Sea Level Rise and Population Growth
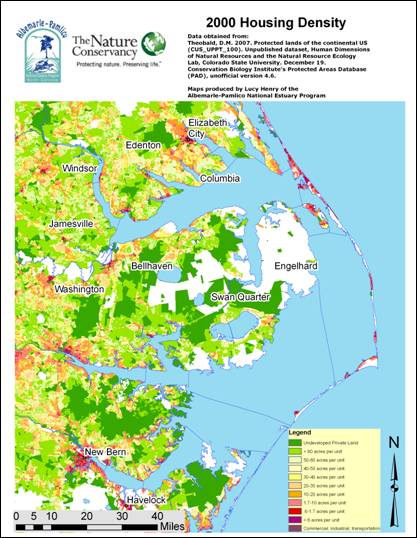
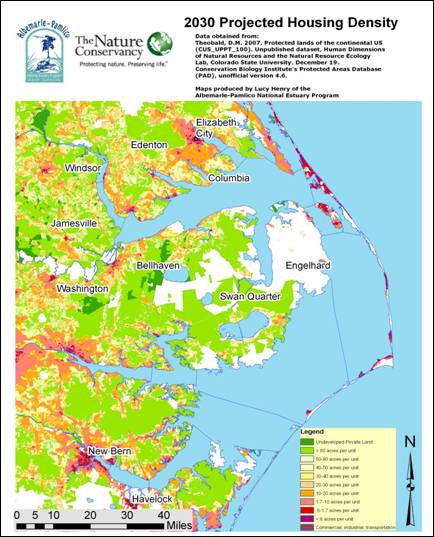
Figure 1. Housing density maps for 2000 and 2030 in the Albemarle-Pamlico Sounds region of North Carolina. White areas represent lands in conservation.
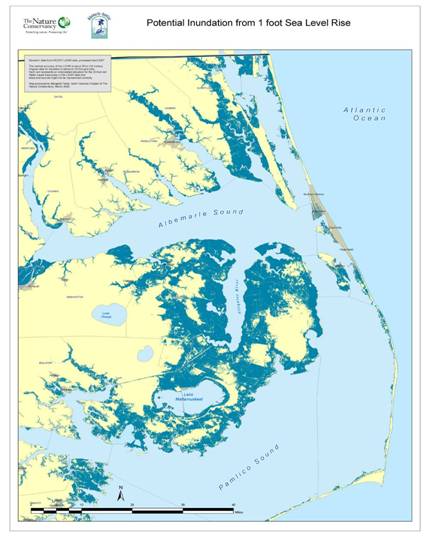
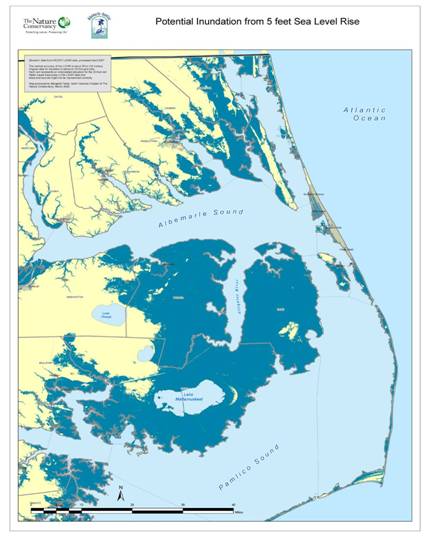
Figure 2. Projected sea level rise inundation from 1 foot and 5 feet of sea level rise in the Albemarle-Pamlico Sounds region of North Carolina.