Implementation of Environmental Programs: Environmental Indicators and Outcome Metrics: International Organization
The fact sheet identifies some key international organizations and their roles in developing waste-related environmental indicators and other metrics to further sustainability goals. Numerous countries, including the U.S., have benefited from the work of the Organization for Economic Cooperation and Development (OECD), United Nations Commission on Sustainable Development (UN CSD), European Union (EU), World Bank, and other organizations. The international organizations addressed in this summary emphasize the functions of social and economic factors when assessing environmental programs and needs in order to understand underlying forces that shape environmental conditions. This factsheet is not comprehensive; rather, it provides a starting point for readers interested in investigating the topic.
- International Roles in Metrics Development
- Organization for Economic Cooperation and Development (OECD) - environmental indicators and outlooks
- United Nations Commission on Sustainable Development (UN CSD) -indicators of sustainable development
- European Union (EU)
- World Bank
- Some U.S. Activities and Additional Resources
International Roles in Metrics Development
This section highlights some innovative approaches taken to the development of environmental indicators (EIs) and other performance metrics by the OECD, UN CSD, EU, and World Bank.
Organization for Economic Cooperation and Development (OECD) - environmental indicators and
outlooks
![]() . OECD has pioneered the pressure-state-response
(PSR) model to structure its work on environmental policy and reporting. The PSR framework, or modified versions of it, is being used worldwide as a reporting tool. The graphic below helps to describe
the PSR model.
. OECD has pioneered the pressure-state-response
(PSR) model to structure its work on environmental policy and reporting. The PSR framework, or modified versions of it, is being used worldwide as a reporting tool. The graphic below helps to describe
the PSR model.
The OECD Pressure-State-Response Framework
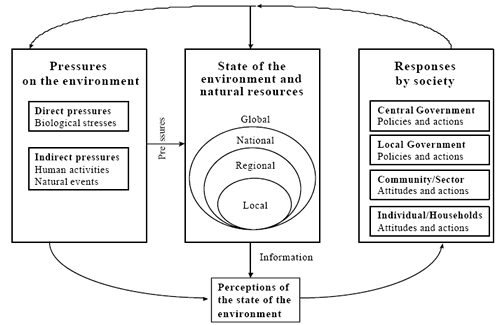
OECD has developed:
- core environmental indicators - a set of 50 indicators designed to track environmental progress and analyze performance of environmental policies in OECD member countries.
- key environmental indicators - a subset of Core environmental indicatorss that inform the public and provides key signals to policy makers on important environmental issues and trends.
- sectoral environmental indicators - a set of indicators intended to help integrate environmental concerns into sectoral policies, such as transportation, energy, and agriculture. The indicators are classified using an adjusted PSR model that reflects sectoral environmental trends and related economic and policy considerations.
- indicators derived from environmental accounting - indicators designed to integrate environmental concerns into economic and resource management policies, such as efficiency of material use.
United Nations Commission on Sustainable Development (UN CSD) - indicators of sustainable development
![]() .
The UN CSD framework for indicators
.
The UN CSD framework for indicators
![]() adapts the OECD PSR model. UN CSD uses a driving force,
state, and response (DSR) framework; driving forces (rather than pressures) include the economic, social, and institutional aspects of sustainable development and may reflect either positive or negative impacts.
UN CSD’s use of the DSR framework has prompted other international organizations, such as the World Bank, and some countries to use this conceptual model. UN CSD developed a "theme based" set
of 58 social, environmental, economic, and institutional indicators to focus attention on sustainable development. Each of these four themes is broken down into sub-themes and associated indicators. For
example, the economic category includes is a sub-theme of waste generation and management. This sub-theme has four associated indicators: generation of industrial and municipal solid waste; generation of
hazardous waste; management of radioactive waste; and waste recycling and reuse.
adapts the OECD PSR model. UN CSD uses a driving force,
state, and response (DSR) framework; driving forces (rather than pressures) include the economic, social, and institutional aspects of sustainable development and may reflect either positive or negative impacts.
UN CSD’s use of the DSR framework has prompted other international organizations, such as the World Bank, and some countries to use this conceptual model. UN CSD developed a "theme based" set
of 58 social, environmental, economic, and institutional indicators to focus attention on sustainable development. Each of these four themes is broken down into sub-themes and associated indicators. For
example, the economic category includes is a sub-theme of waste generation and management. This sub-theme has four associated indicators: generation of industrial and municipal solid waste; generation of
hazardous waste; management of radioactive waste; and waste recycling and reuse.
European Union (EU) – European Environment Agency (EEA) core set of indicators
![]() and Eurostat sustainable development indicators
and Eurostat sustainable development indicators
![]() .
EEA and Eurostat, the statistical office of the EU, have worked cooperatively on indicators to support the EU’s Sustainable Development Strategy. EEA and Eurostat define these indicators
according to the driving force-pressure-state-impact-response (DPSIR) model. In contrast with some other models for indicator development, the DPSIR model emphasizes causal links and relationships between
various aspects of human activities and the environment. EEA focuses on development of the pressure (e.g., pollution), state (e.g., air, water) and impact (e.g., ill health, biodiversity loss) indicators,
and Eurostat focuses on indicators for driving force (e.g., industry) and response (e.g., regulation). These agencies inform decision-makers and the general public, using sustainable development
indicators (SDI), and a core set of indicators (CSI) oriented toward environmental media. The following table identifies the ten EU sustainable development themes addressed by SDIs:
.
EEA and Eurostat, the statistical office of the EU, have worked cooperatively on indicators to support the EU’s Sustainable Development Strategy. EEA and Eurostat define these indicators
according to the driving force-pressure-state-impact-response (DPSIR) model. In contrast with some other models for indicator development, the DPSIR model emphasizes causal links and relationships between
various aspects of human activities and the environment. EEA focuses on development of the pressure (e.g., pollution), state (e.g., air, water) and impact (e.g., ill health, biodiversity loss) indicators,
and Eurostat focuses on indicators for driving force (e.g., industry) and response (e.g., regulation). These agencies inform decision-makers and the general public, using sustainable development
indicators (SDI), and a core set of indicators (CSI) oriented toward environmental media. The following table identifies the ten EU sustainable development themes addressed by SDIs:
EU Themes Addressed by Sustainable Development Indicators |
|
The ten themes are further broken down into sub-themes and "areas to be addressed" that merit additional analysis.
World Bank
2006 World Bank Development Indicators (WDI)
![]() .
The WDI include more than 900 indicators in over 80 tables organized in 6 sections: world view; people; environment; economy, states and markets; and global links.
Environmental indicator initiatives within the World Bank include the Little Green Book and a sustainability indicator building on concepts of green national accounts.
.
The WDI include more than 900 indicators in over 80 tables organized in 6 sections: world view; people; environment; economy, states and markets; and global links.
Environmental indicator initiatives within the World Bank include the Little Green Book and a sustainability indicator building on concepts of green national accounts.
Some U.S. Activities and Additional Resources
EPA and other government agencies in the United States at the federal, state, and local levels have undertaken efforts to develop environmental indicators and measure government performance. Below are selected brief descriptions and links for some of this work.
- Report on the Environment. As the first step in EPA’s multi-year Environmental Indicators Initiative, in 2003 EPA published its draft Report on the Environment (ROE) and supporting materials. EPA is developing a 2007 ROE.
- Government Performance and Responsibility Act (GPRA). GPRA requires U.S. federal agencies to develop five-year strategic plans, including a mission statement, which set out long-term goals and objectives. GPRA also requires federal agencies to develop annual performance plans, which provide annual performance commitments toward achieving the goals and objectives presented in the strategic plan, as well as annual performance reports, which evaluate an agency's progress toward achieving performance commitments.
- Program Evaluation. Developed by the U.S. Office of Management and Budget (OMB) to assess the performance of federal programs.
- Superfund environmental indicators. Superfund environmental indicators are measures of program performance used to communicate tangible progress made in protecting human health and the environment through site clean up activities.
- corrective action environmental indicators. EPA uses environmental indicators (EIs) for human exposure and groundwater to measure progress in the RCRA Corrective Action Program.
- AIRNOW. The Air Quality Index (AQI), a joint undertaking coordinated among a number of agencies, reports daily air quality. EPA calculates the AQI for five major air pollutants regulated by the Clean Air Act: ground-level ozone, particle pollution (also known as particulate matter), carbon monoxide, sulfur dioxide, and nitrogen dioxide.
- biological indicators of watershed health. EPA’s biological indicators are numerical values derived from actual measurements and have known statistical properties.
- America’s Children and the Environment (ACE): Summary List of Measures. ACE brings together, in one place,
quantitative information from a variety of sources to show trends in levels of environmental contaminants in air, water, food, and soil; concentrations of contaminants measured in the bodies of children
and women; and childhood illnesses that may be influenced by exposure to environmental contaminants
- Global Reporting Initiative (GRI)
 .
Through multi-stakeholder involvement, GRI promotes the use of a sustainability reporting framework worldwide. Over 1000 organizations in over 60 countries use the GRI framework.
.
Through multi-stakeholder involvement, GRI promotes the use of a sustainability reporting framework worldwide. Over 1000 organizations in over 60 countries use the GRI framework.