Japanese Nuclear Emergency: Radiation Monitoring
RadNet Data for San Bernardino, CA
![]() This site contains information and data from March 11, 2011 to June 30, 2011. EPA has returned to routine RadNet operations. This site will continue to be available for historical and informative purposes.
This site contains information and data from March 11, 2011 to June 30, 2011. EPA has returned to routine RadNet operations. This site will continue to be available for historical and informative purposes.
For real-time air monitoring data, please visit the EPA RadNet website and Central Data Exchange. To view both current and historical laboratory data, please visit our Envirofacts database.
On this page:
This page shows multiple types of data from this location, including the gross gamma exposure rate readings from our near-real-time air monitor and data from the detailed laboratory sample analysis. Gamma monitoring results are presented because they are a useful indicator of the radionuclides associated with a nuclear power incident.Gamma Exposure Rate Air Monitoring Data
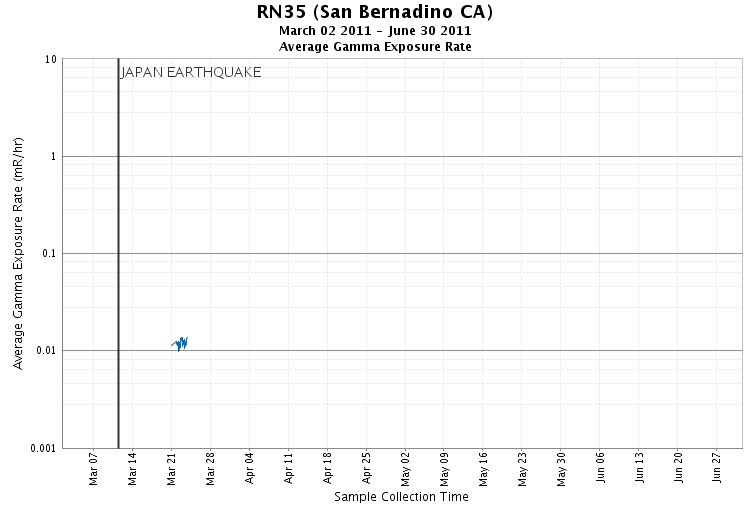
The graph shows the external exposure rate data, which is the dose, or amount of radiation, you would receive on the outside of your body if you were standing in that particular location. Background, or normal, radiation levels depend on factors including altitude and the amount of naturally occurring radioactive elements in the soil. Background external exposure rates typically range between 0.005 and 0.020 millirem per hour (mR/hr) - levels that are thousands of times below any conservative level of concern.
Notes on the Data
- Brief gaps in RadNet data represent instrument error.
- Larger gaps (>1 day) occasionally appear when RadNet monitors are taken offline for servicing.
- A notice is posted when monitors are off-line for servicing. A blank graph indicates that one part of a meter on the monitor is not working.
- Electrical interference can cause spikes, shown on graphs as one point significantly higher than the rest of the data.
- As you view data, be aware that there are often large differences in normal background radiation among the monitoring locations because background radiation levels depend on altitude and the amount of naturally occurring radioactive elements in the local soil. What is natural in one location is different from what is natural in another.
- To get the data shown in this graph, please search using our query tool.
- More information about air monitoring data.
Laboratory Data from Air Filter and Air Cartridge Analysis
During detailed filter analyses from several RadNet air monitor locations across the nation, the U.S. Environmental Protection Agency (EPA) identified trace amounts of radioactive isotopes consistent with the Japanese nuclear incident. These types of findings are to be expected in the coming days and are far below levels of public health concern.
Because EPA repaired the stationary monitor at this location, the deployable monitor was returned to a staging area. The data below shows the readings for both the stationary and deployable air monitor filters and the deployable air monitor cartridge for the time the deployable was in place at this location. The table shows readings only for the stationary air monitor filters afterwards.