Japanese Nuclear Emergency: Radiation Monitoring
RadNet Data for Fort Worth, Texas
![]() This site contains information and data from March 11, 2011 to June 30, 2011. EPA has returned to routine RadNet operations. This site will continue to be available for historical and informative purposes.
This site contains information and data from March 11, 2011 to June 30, 2011. EPA has returned to routine RadNet operations. This site will continue to be available for historical and informative purposes.
For real-time air monitoring data, please visit the EPA RadNet website and Central Data Exchange. To view both current and historical laboratory data, please visit our Envirofacts database.
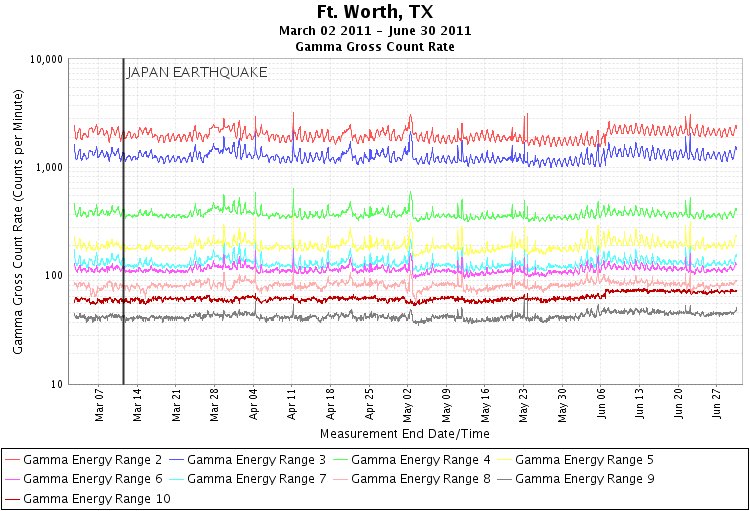
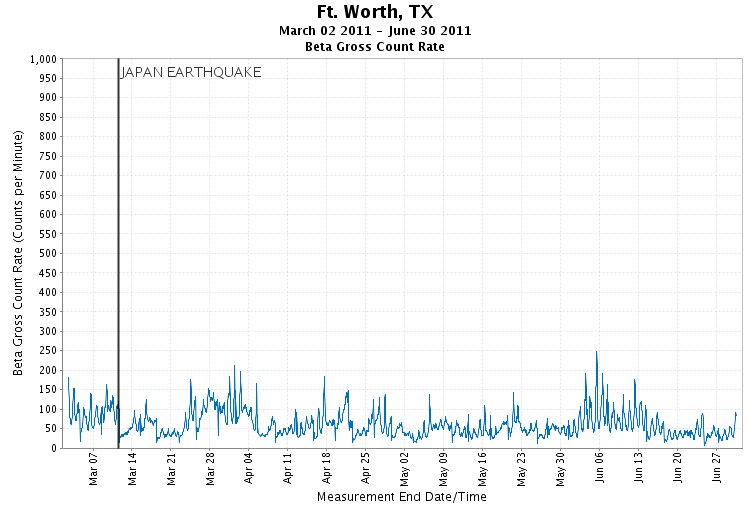
Two types of results from the RadNet near-real-time air monitor are presented below: gamma gross count rate and beta gross count rate. Gamma monitoring results are presented first, because they are a more useful indicator of the radionuclides associated with a nuclear power incident. Beta monitoring results indicate when there is a substantial spike in beta activity at this location.
On this page:
Gross Gamma Air Monitoring Data
To-date, levels recorded at this monitor have been thousands of times below any conservative level of concern.

The gamma data measures radiation from all radionuclides that emit gamma rays and splits them into ranges of energy. The word gross, or total, indicates that the measurement is from all gamma emitting radionuclides. Not all gamma rays have the same amount of energy. Breaking the data into discrete energy ranges helps scientists to determine which radionuclides may be present. (Learn more about gamma radiation.)
Notes on the Data
- Brief gaps in RadNet data represent instrument error.
- Larger gaps (>1 day) occasionally appear when RadNet monitors are taken offline for servicing.
- A notice is posted when monitors are off-line for servicing. A blank graph indicates that one part of a meter on the monitor is not working.
- Electrical interference can cause spikes, shown on graphs as one point significantly higher than the rest of the data.
- As you view data, be aware that there are often large differences in normal background radiation among the monitoring locations because background radiation levels depend on altitude and the amount of naturally occurring radioactive elements in the local soil. What is natural in one location is different from what is natural in another.
- To get the data shown in this graph, please search using our query tool.
- More information about air monitoring data.
Gross Beta Air Monitoring Data
To-date, levels recorded at this monitor have been thousands of times below any conservative level of concern.

The beta gross count rate measures the radiation from all radionuclides that emit beta particles, which is indicated by the term gross or total. The term count rate tells us how quickly beta particles are being detected, which indicates how much radioactivity the monitor is seeing. (Learn more about beta radiation.)
Notes on the Data
- Brief gaps in RadNet data represent instrument error.
- Larger gaps (>1 day) occasionally appear when RadNet monitors are taken offline for servicing.
- A notice is posted when monitors are off-line for servicing. A blank graph indicates that one part of a meter on the monitor is not working.
- Electrical interference can cause spikes, shown on graphs as one point significantly higher than the rest of the data.
- As you view data, be aware that there are often large differences in normal background radiation among the monitoring locations because background radiation levels depend on altitude and the amount of naturally occurring radioactive elements in the local soil. What is natural in one location is different from what is natural in another.
- To get the data shown in this graph, please search using our query tool.
- More information about air monitoring data.
