|
|
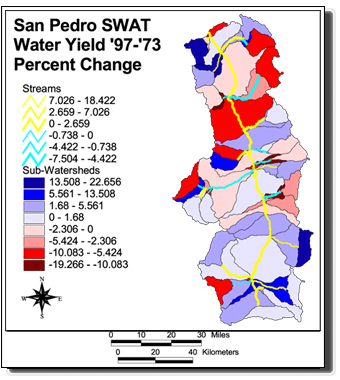
Notice: The AGWA-SWAT output shown above (water yield) is only one of many outputs associated with this dataset. For a complete listing of outputs please consult the attribute information in the metadata. Disclaimer: The data shown are not observed values or results from a calibrated model. They are average annual values derived from an uncalibrated model (SWAT) run through AGWA using all its default inputs, and a distributed 12-year precipitation record (1960-72) from 7 gauges around the basin. These data are provided for demonstration purposes only, and should not be used for scientific analysis. The above map image shows
percent change in average annual water yield that results from comparing
two SWAT simulations: one with inputs derived (through AGWA) from the
1973 land-cover data, and one with inputs derived from the 1997
land-cover data. Positive values (shown in blue) indicate an
increase in water yield between 1973 and 1997. Additional model
outputs can be viewed using the AGWA tool. AGWA outputs are
useful for identifying where the greatest changes are likely to occur,
but quantitative analysis is NOT recommended.
|