- Energy Recovery Home
- Basic Information
- Waste Management Hierarchy
- Related Regulations
- Frequent Questions
- Additional Information
Air Emissions from MSW Combustion Facilities
- Comparison with emissions from other sources
- History of changes over time from MSW combustion facilities and other sources
- Air toxics emissions
- Air toxics impacts
- Steps EPA is taking to make sure MSW combustion facilities stay safe
- Dioxins
- Greenhouse Gases (GHGs)
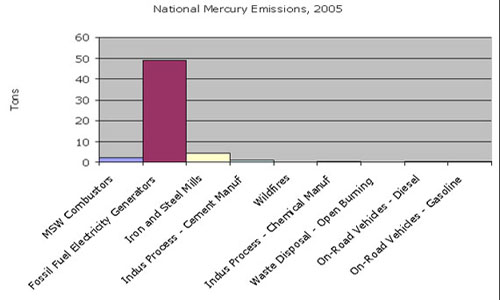
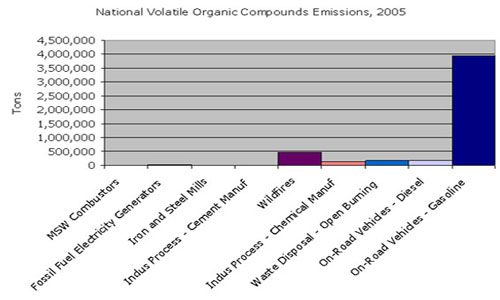
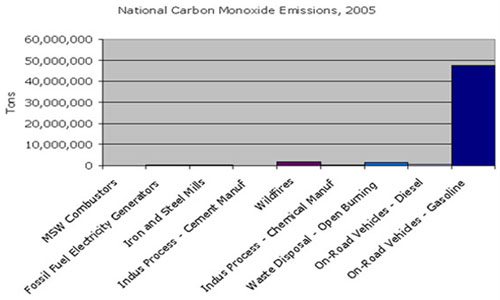
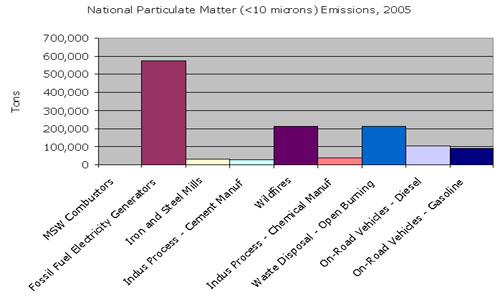
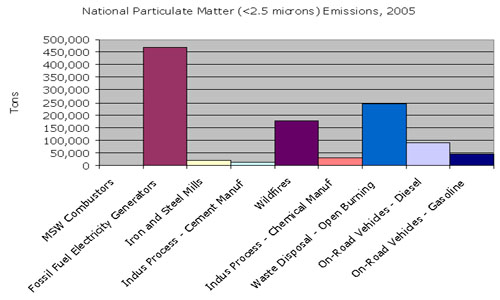
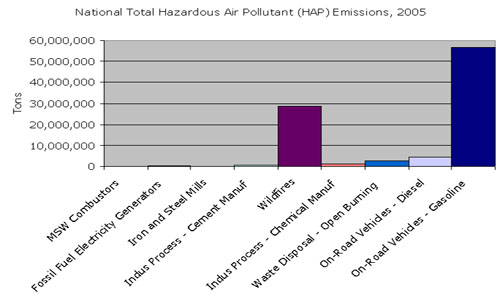
Comparison with emissions from other sources
The graphs below compare the emissions of municipal solid waste (MSW) combustors (also called Waste to Energy plants) emissions to emissions from other sources like:
- Coal and natural gas fired power plants (Fossil Fuel Electricity Generators);
- Iron and Steel Mills;
- Cement Manufacturers;
- Wildfires;
- Chemical Manufacturing;
- Waste Disposal via Uncontrolled or Open Burning; and
- Diesel and Gasoline Vehicle Emissions.
These graphs are based on EPA’s 2005 National Emissions Inventory data. More information is available at EPA’s Clearinghouse for Inventories and Emissions. On-road vehicle emissions (from cars, trucks, etc.) are responsible for most of the volatile organic compounds, carbon monoxide, and hazardous air pollutants generated. Of these sources, fossil fuel electricity generators are responsible for most of the mercury and particulate matter generated.
History of changes over time from MSW combustion facilities and other sources
In 1990, EPA developed Maximum Achievable Control Technology (MACT) standards under the Clean Air Act for municipal solid waste (MSW) combustors. Emissions from MSW combustion facilities decreased by a factor of twenty after the MACT controls were put in place. The table below shows emission trends from 1990-2005 based on available data from the National Emissions Inventories. Total emissions of hazardous air pollutants have dropped more than 94 percent in this time period from nearly 58,000 tons in 1990 to about 3,300 tons in 2005.
Emissions from other source categories have declined over time as well. The graphs below indicate trend data for carbon monoxide (CO), nitrogen oxides (NOx), particulate matter less than 2.5 microns in diameter (PM2.5), and volatile organic compounds (VOCs). Total emissions are illustrated on the graphs as well as emissions from well-known source categories. Vehicle emissions are a major source for many of these pollutants. This is important to note because it puts into perspective the exposure and hazard potential from industrial sources. The Air Emission Sources website provides information on other pollutants. For more information on trends, please visit National Emissions Inventory (NEI) Air Pollutant Emissions Trends Data. MSW combustion facilities are combined with other industries in the “Waste Disposal and Recycling” category.
(Click on images for a larger size)
Air toxics emissions
The table below shows how much emissions from MSW combustion facilities have declined post-MACT from 1990-2005. You can see from the table below that these regulations have significantly reduced emissions, in many cases, by more than 95 percent.
| Emissions from Large and Small MSW Combustion Facilities Pre- vs. Post-MACT Comparison | |||
|---|---|---|---|
| Pollutants | 1990 Emissions (tons per year) | 2005 Emissions (tons per year) | Percent Reduction |
| Mercury | 57 | 2.3 | 96% |
| Cadmium | 9.6 | 0.4 | 96% |
| Lead | 170 | 5.5 | 97% |
| Particulate Matter | 18,600 | 780 | 96% |
| Hydrogen Chloride | 57,400 | 3,200 | 94% |
| Sulfur Dioxide | 38,300 | 4,600 | 88% |
| Nitrogen Oxides | 64,900 | 49,500 | 24% |
Dioxin and furan emissions are measured in grams on what is known as a “toxic equivalent quantity” or TEQ basis. There are many kinds of dioxins and furans. “TEQ” takes into account the fact that different dioxin and furan molecules have different hazard levels. Dioxin and furan emissions declined more than 99 percent from 4,400 grams TEQ in 1990 to 15 grams TEQ in 2005.
Air toxics impacts
The toxics generated by MSW combustion facilities are tightly regulated by the Maximum Achievable Control Technology (MACT) standards under the Clean Air Act. All activities that involve combustion, such as power plants, cement plants, metal smelters, and fuel-fired engines generate air emissions. The risk from these emissions must be put into context. EPA conducts ongoing evaluations of air toxics in the United States, which include estimates of cancer and non-cancer (nausea, asthma, bronchitis, etc.) health effects based on chronic exposure from outdoor sources. EPA’s Air Pollution and Health Risk web page helps to put risk into perspective.
Case-specific data for an MSW combustion facility in Montgomery County, Maryland show that the overall cancer and non-cancer risk to human health has always been below EPA benchmarks and — in many cases — have actually decreased over time despite incorporating new risk methods and more exposure pathways. Multiple independent risk studies ![]() were conducted before and after the MSW combustion facility was built and the risk posed by the plant has been continually re-analyzed.
were conducted before and after the MSW combustion facility was built and the risk posed by the plant has been continually re-analyzed.
Steps EPA is taking to make sure MSW combustion facilities stay safe
The states and EPA work together to ensure that MSW combustion facilities are complying with emission standards. States have developed regulations of their own to implement the federal MACT standards. You can check the compliance status of MSW combustion facilities and other types of facilities in your area at: Environmental Compliance History Online.
EPA is also voluntarily re-examining the MACT emissions levels using additional MSW combustion facility data through 2008. Preliminary analysis of these data shows that emissions have been well below the existing MACT standards and maintain high performance levels. You can check on the latest regulatory updates at EPA’s Air Toxics website.
You can also find information on land, water, and air emissions at EPA’s one-stop shop for environmental data known as Envirofacts.
Continued state and EPA efforts to reduce the amount of hazardous material in MSW also translate into lower emissions. For example, improving mercury management practices and phasing mercury out of products like thermostats means there is less mercury in MSW and hence less mercury emissions from MSW combustion facilities.
Dioxins
“Dioxins” refer to a group of chemical compounds that share similar characteristics. Dioxins are known to cause cancer in animals and likely in humans. They may also cause other reproductive or developmental effects. Dioxins from MSW combustion facilities are not present in the waste itself, they are by-products generated from the combustion of chlorinated wastes. Improved combustion technology and air pollution controls have dramatically reduced the quantity of dioxins emitted from MSW combustion facilities. The US Government’s Interagency Work Group on dioxin has prepared a useful question and answer document ![]() . This workgroup is composed of federal agencies that address health, food, and environmental concerns. Some relevant highlights from this document include:
. This workgroup is composed of federal agencies that address health, food, and environmental concerns. Some relevant highlights from this document include:
Over the past few decades, EPA has aggressively looked for ways to reduce and control dioxins in the environment in the United States. Collectively, these actions have resulted in strict controls on all of the known and quantifiable major industrial sources of dioxin releases. As a result of EPA's efforts, along with efforts by state governments and private industry, known and quantifiable industrial emissions in the United States have been reduced by more than 90% from 1987 levels. For example,(municipal waste combustors are estimated to have emitted collectively nearly 18 pounds of dioxin toxic equivalents in 1987, but under EPA regulations they are now expected to emit less than 1/2 ounce per year. Similarly, medical waste incinerators emitted about 5 pounds of dioxin equivalents in 1987, but under EPA regulations they now will be limited to about 1/4 ounce annual emissions. EPA has implemented similarly strict standards for other dioxin sources.
Greenhouse Gases (GHGs)
Estimates of greenhouse gas emissions from US MSW combustion facilities range from 10 to 20 million metric tons, depending on the different methods used to estimate the biogenic fraction of MSW. Regardless, it is a small fraction of the nearly six billion tons emitted by the combustion of fossil fuels. Per unit of electricity produced, the MSW combustion facilities generate less GHGs than coal or oil, but slightly more GHGs per unit energy than natural gas. EPA’s climate change website addresses air emissions of electricity generation from different sources. The value reported on this website for MSW (2,988 pounds of carbon dioxide per megawatt-hour) includes emissions for both the biogenic and fossil fractions of MSW. However, when considering carbon dioxide (CO2) emissions from MSW combustion, it is necessary to count only emissions from fossil fuel-based products, like plastics. The biogenic fraction of MSW is material generated from living organisms and is already in the planet ’s carbon cycle. This biogenic fraction should not be included when determining the GHG outputs of combusting MSW for energy recovery. In the table below, we use EPA’s eGrid (a database of information on electrical generators in the United States) that indicates about 53 percent of the energy generated by MSW combustion facilities is from biogenic sources and 47 percent is fossil-derived power. eGrid relies on the Department of Energy’s Energy Information Administration methodology for allocating MSW to biogenic/non-biogenic energy (which, in turn, relies on EPA's Annual MSW Report) and information about MSW combustor type.
| Fuel | CO2 (pounds per megawatt hour) |
|---|---|
| MSW | 1016 |
| Coal | 2249 |
| Oil | 1672 |
| Natural Gas | 1135 |
Life-cycle emission analysis of MSW combustion considers factors like:
- Avoided methane emissions from landfills;
- Energy generation potential that offsets fossil fuel use;
- Metals recovery (recycling);
- Emission savings from the avoidance of long-distance transport to landfills.
Two EPA-sponsored models have been developed to examine life-cycle emissions from different management methods of MSW: the Waste Reduction Model (WARM) and the MSW Decision Support Tool (DST) (PDF) (2 pp, 470K, about PDF). These models both show that MSW combustors actually reduce the amount of GHGs in the atmosphere compared to landfilling. The savings are estimated to be about 1.0 ton of GHGs saved per ton of MSW combusted.