RETIGO
Complex air measurement data made understandable with RETIGO
Published in October 2015
The explosion in grassroots efforts to collect and analyze data about our environment has benefited both citizens and scientists. There are now portable air monitors that, together with handheld GPS units, give people an idea of the air pollution in their neighborhood. Some devices are so easy to use that they can be strapped to a bicycle and turned on while pedaling to work. The problem comes later. Analyzing the data often requires using sophisticated software packages and technical training.
A new easy-to-use software program developed by EPA called RETIGO (Real Time Geospatial Data Viewer) has made data analytics of environmental measurements as easy as using common spreadsheet programs, according to Gayle Hagler, EPA environmental engineer and one of the developers.
“Before RETIGO, I would have to write programming scripts, and that process would take a significant amount of time,” Hagler says. “We created this tool to lower the technical bar and provide new ways of exploring geospatial air measurement data without having to first become a computer programmer.”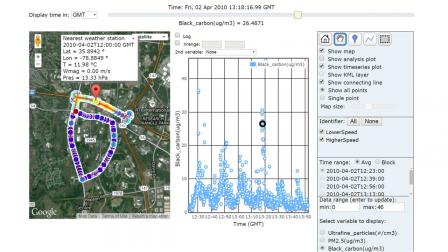 Data displayed in RETIGO.
RETIGO allows users to input complex data such as pollution concentrations, wind speed and direction, time of day, and location via GPS. They can then plot the data on a map and on several graph options to observe trends. The local data can be integrated with air quality data available on AirNow, a multi-agency online resource provided by EPA and others that offers air quality data and the Air Quality Index. This enables users to compare their data in a given area to regulatory measurements collected nearby.
RETIGO is very interactive, making it possible to analyze data in many ways. The program allows the user to import data and has virtually no limit on data size. Next, the user can quickly explore the data – they can toggle between various air pollutants, isolate areas of interest on a map to explore further, and customize the graphs. RETIGO also allows the user to figure out concentrations along a line from local point sources of pollution.
“Let’s say I rode my bike near a highway and I think the traffic is contributing to pollution levels and I want to explore it,” Hagler says. “RETIGO would allow me to view the data on a map, see changes in the data over a period of time, and compare air pollution concentrations at different distances from the highway.”
RETIGO has received a positive response from users across the country with more than 1,300 active uses of the data tool during the first four months of release to the public.
“We are seeing a significant growth of citizens who are interested in collecting and exploring data themselves, as well as students or community groups who are buying equipment and developing some technical skill sets,” Hagler says.
Hagler says RETIGO is also helping EPA researchers with their own research. “I’m using it in my own projects.”