EPA Science Matters Newsletter: Nutrients: How much is too much? (Published January 2014)

Nitrogen and phosphorus are naturally-occurring nutrients that are necessary for life. However, human activities can release an excess of these nutrients into the air, land, and water, upsetting natural cycles and threatening ecosystems and “ecosystem services”—such as fertile soil, and clean air and water. Such excess nutrients, referred to as nutrient pollution, threaten environmental and human health across the country.
Nutrient pollution comes from a variety of sources that vary depending on geographic location and local land uses. Some sources are agricultural runoff, power plant and motor vehicle emissions, urban stormwater runoff, wastewater from sewers and septic systems, and on a smaller scale, the overuse of home fertilizers.
EPA scientists are doing research to support actions and decisions to combat nutrient pollution. Research efforts include studying the sources of nutrient pollution, advancing the understanding of how ecosystems respond to nutrient pollution, identifying nutrient pollution indicators to help decision makers establish and set water quality standards in accordance with the Clean Water Act, evaluating the benefits and costs associated with nutrient management choices, and developing decision tools to help control nutrient pollution in a sustainable way.
Examples of that work—and its impact—can be seen in the following stories highlighting EPA research and partnerships in some of the most productive and economically important water bodies in the country. These include New England’s Narragansett Bay, waters throughout the State of Florida, and Chesapeake Bay, the largest estuary in the United States.
More than 100,000 miles of rivers and streams, close to 2.5 million acres of lakes, reservoirs and ponds, and more than 800 square miles of bays and estuaries in the United States have poor water quality due to nutrient pollution.
Mapping Nitrogen

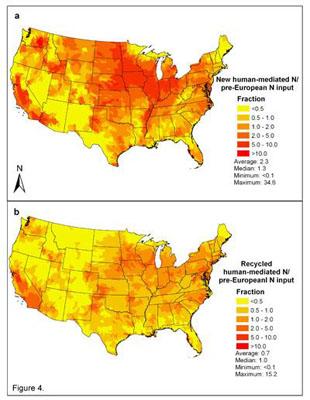
Efforts to address challenges related to excess nitrogen require painting an accurate picture of where it is coming from. EPA ecologist Jana Compton, Ph.D., in collaboration with National Research Council Fellow Daniel Sobota, Ph.D., and John A. Harrison, Ph.D., of Washington State University recently published results of a study they conducted synthesizing several decades of research on nitrogen. They used their research results to create a series of maps illustrating both human and natural sources of nitrogen in the environment.
The researchers estimate average annual U.S. nitrogen input to the environment at three times levels before the turn of the 20th century. That’s upwards of 25,000,000 metric tons, or roughly the mass of 75 Empire State Buildings.
Compton believes that the research and other work will be invaluable in supporting EPA efforts to help states develop nutrient criteria for protecting their waters, and to prioritize watersheds for nutrient reduction efforts. “Identifying which watersheds carry higher nitrogen loads would be a big step toward developing strategies to reduce nutrient levels reaching rivers and streams,” she explains.
The information presented in the spatial distribution maps will be incorporated into EnviroAtlas as it is developed, EPA’s interactive, web-based application for viewing and mapping ecosystem services.
