News Releases from Region 02
EPA and Puerto Rico Environmental Quality Board Collaborate to Control and Monitor Air Pollution in Puerto Rico
08/06/2018
(New York, N.Y. – August 6, 2018) The U.S. Environmental Protection Agency (EPA) is continuing to work with the government of Puerto Rico to fully re-establish its air monitoring network in the aftermath of Hurricane Maria. The network is a key component to ensuring air quality and protection of people’s health in Puerto Rico. The Agency has also just awarded the Puerto Rico Environmental Quality Board (PREQB) more than $22,000 in additional funding to support its air pollution control and air monitoring programs. The new funding brings the total amount awarded by EPA to PREQB to more than $880,000. It will help Puerto Rico in its efforts to meet the national air quality standards and protect air quality and people’s health.
“As Puerto Rico recovers from the hurricanes, it is critically important that we continue to support the Commonwealth’s efforts to protect air quality for its 3.3 million residents,” said EPA Regional Administrator Pete Lopez. “EPA’s strong partnership with the people of Puerto Rico is important to maintaining a healthy environment. We know we can achieve our best environmental results by working together.”
Puerto Rico’s EQB Analytical Laboratory in San Juan was severely impacted by Hurricane Maria and required major work to make it fully operational so that it can analyze air samples. In addition to lab repairs, EPA is assisting in repairing, re-energizing and rebooting the government’s air monitoring network. Nitrogen dioxide, sulfur dioxide, lead, fine air particles, ozone, and carbon monoxide can adversely affect people’s health. Thus, it is critically important to have a reliable and state-of-the art air monitoring network in place.
For the air monitoring network, EPA:
• assessed each of the 19 air monitoring stations and determined what was needed to replace
or repair the instrument;
• coordinated with the manufacturers to ensure that new equipment meets requirements;
• expects delivery soon on the final group of equipment and instrumentation;
• repaired all air quality measurement stations and enclosures;
• will be conducting training for operational startup of the stations; and
• anticipates having all monitoring stations up and running by October.
Air Pollution Control Program Support – $22,063 in new funding; $880,271 total for the year
This grant will assist PREQB in its efforts to implement air pollution control programs throughout Puerto Rico. These programs include:
• developing and implementing regulations for stationary sources of air pollution;
• updating regulations for mobile sources of air pollution, such as cars, commercial trucks,
aircrafts, marine vessels, and heavy equipment;
• improving emissions data and modeling; and
• operating a monitoring network.
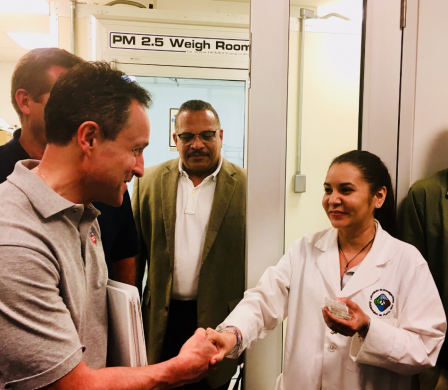 Air Sampling and Analysis – PREQB Lab; April 2018. Photo courtesy of U.S. EPA.
Background:
EPA’s most recent air trends report highlights that, between 1970 and 2017, the combined emissions of six key pollutants dropped by 73 percent, while the U.S. economy grew more than three times. A closer look at more recent progress shows that between 1990 and 2017, average concentrations of harmful air pollutants decreased significantly across our nation:
- Sulfur dioxide (1-hour) ↓ 88 percent
- Lead (3-month average) ↓80 percent
- Carbon monoxide (8-hour) ↓ 77 percent
- Nitrogen dioxide (annual) ↓ 56 percent
- Fine Particulate Matter (24-hour) ↓ 40 percent
- Coarse Particulate Matter (24-hour) ↓ 34 percent and
- Ground-level ozone (8-hour) ↓ 22 percent
EPA continues to work with states, local governments, tribes, and citizens – to further improve air quality across for all Americans.
EPA’s Our Nation’s Air report includes interactive graphics that enable citizens, policymakers, and stakeholders to view and download detailed information by pollutant, geographic location, and year. Explore the report and download graphics and data here: https://gispub.epa.gov/air/trendsreport/2018/
For more information about particulate pollution and PM 2.5, visit https://www.epa.gov/pm-pollution.
Follow EPA Region 2 on Twitter at http://twitter.com/eparegion2 and visit our Facebook page,
http://facebook.com/eparegion2.
18-057 # # #