About Estuary Data Mapper (EDM)
The Estuary Data Mapper (EDM) is a free, interactive graphical application under development by the US EPA that allows scientific researchers to quickly and easily:
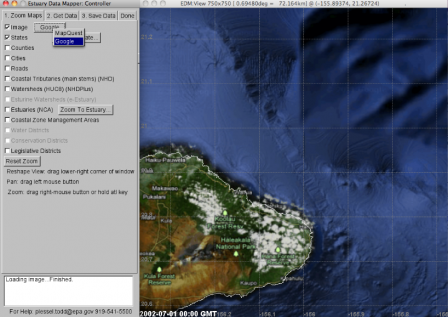
- View and select estuary-scale geographical regions of interest - i.e., pan and zoom a map of the US coastal states displaying watersheds, streams and estuaries, land coverage, satellite images, etc.
- Retrieve and view specified water-quality data, gauge measurements of tides and freshwater discharges, gridded modeled nitrogen deposition, land use, topography/bathymetry, satellite data, etc., subsetted by date-time and lat-long rectangle. (Data streamed via web servers at EPA, NOAA, USGS, USFWS, etc. Examples of water-quality data points include dissolved oxygen, turbidity and chlorophyll.)
The data are available in the following formats:- PNG images,
- MPG movies,
- KML files,
- ESRI shapefiles, and
- ESRI ACII grids.
- Save the resulting data subsets (as Shapefiles, grid files, etc.) for further analysis and import into the EPA estuarine data model, ArcGIS or open source GIS, GoogleEarth, etc.
The list of available maps and data is expanding during development and is shown in the EDM GUI. (Grayed-out buttons indicate a not-yet-implemented feature.)
EDM Mailing Lists
- EDM-Announcements. Receive periodic announcements of software updates and new data added to EDM. Send an email to edm@epa.gov with "EDM Announcements" in the subject line.
- EDM-Discussion. Join other EDM users in an email discussion group. Send an email to edm@epa.gov with "EDM Discussion" in the subject line and give us permission to share your email address with other EDM users.
Screenshots:
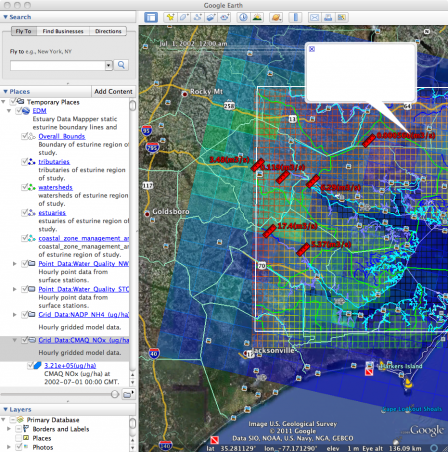
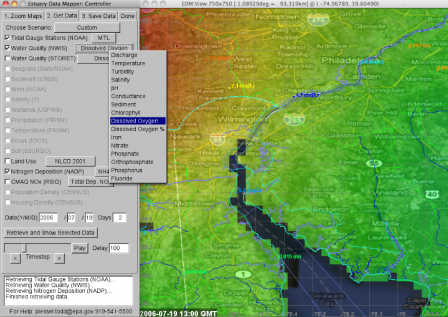
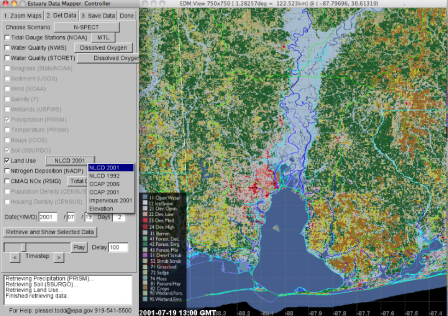
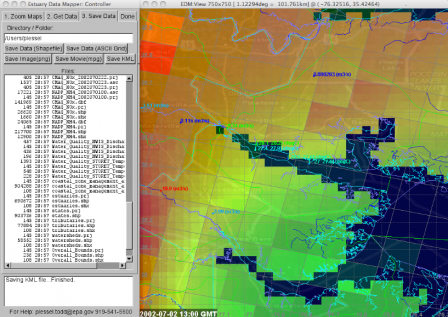
- Multiple data layers: e.g. gridded deposition, water quality, tidal gauge stations, etc. retrieved with one click and displayed and saved in seconds:
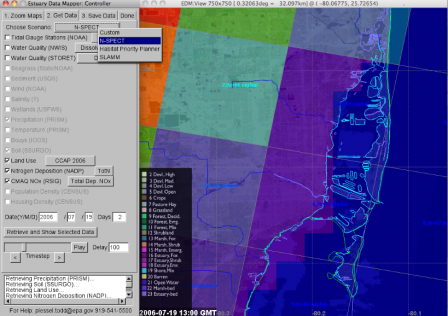
- One-click dataset selections for popular scenarios / decision-support tools:
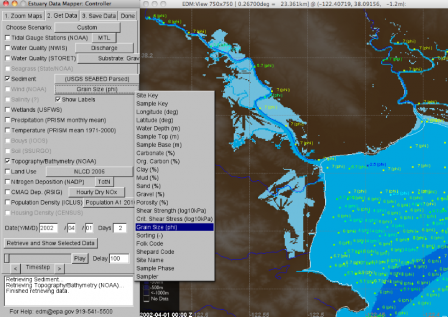
- Sediment core samples:
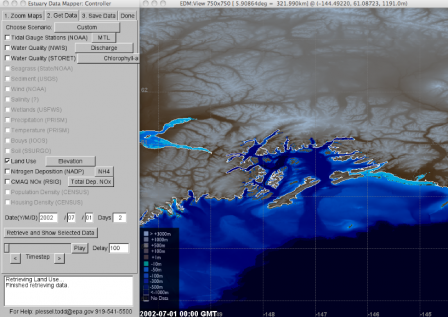
- Land use (30-meter resolution):
- Topography/Bathymetry:
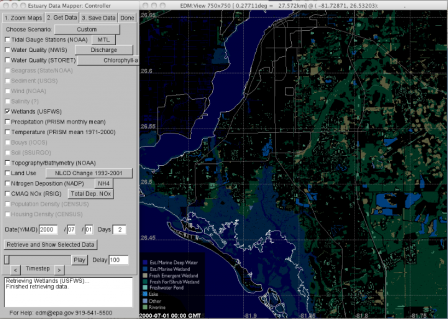
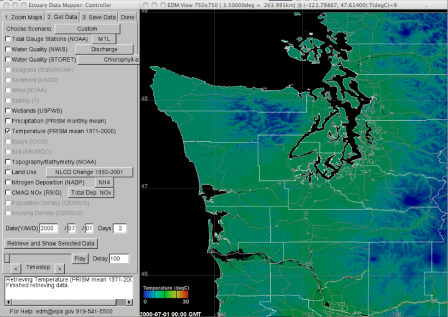
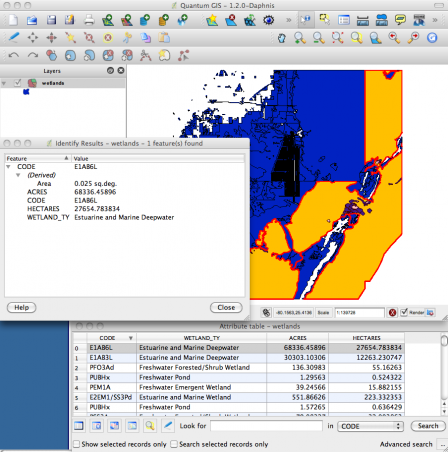
- Polygonal Data: Wetlands, Temperature, etc.:
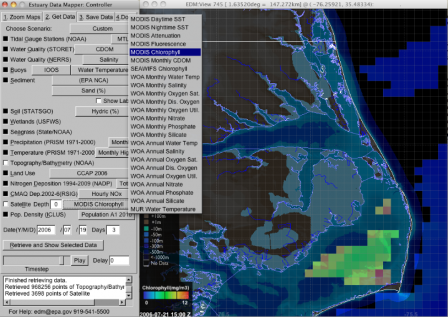
- Satellite-measured water-quality data:
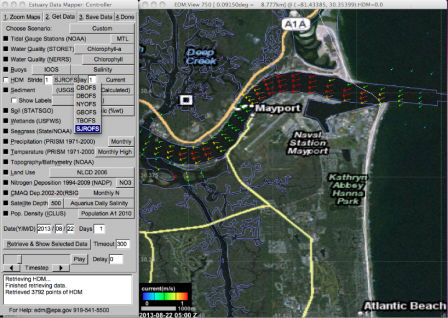
- Modelled meteorology and hydrodynamics data:
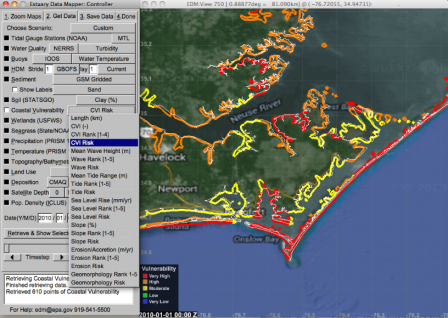
- Modelled coastal vulnerability data:
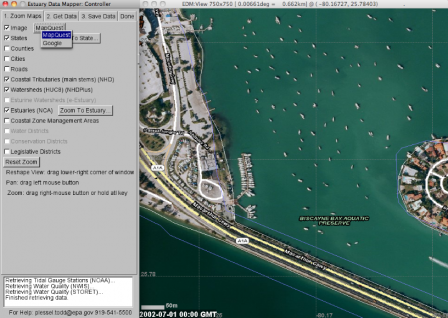
- High-resolution satellite imagery:
- Save subset data to ArcGIS, GoogleEarth, etc:
- Quantum GIS:
- Google Earth: