Analysis and Trends
The links below show our progress in meeting performance targets and the trends in our enforcement results.
- Government Performance and Results Act (GPRA)
GPRA Measure Number FY 2017 GPRA Measure Target Actual (rounded) 409 Number of federal inspections and evaluations. 14,000 11,800 410 Number of civil judicial and administrative enforcement cases initiated. 2,700 1,900 411 Number of civil judicial and administrative enforcement cases concluded. 2,400 2,000 412 Percentage of open consent decrees reviewed for overall compliance status. 100% 100% 418 Percentage of criminal cases having the most significant health, environmental, and deterrence impacts. 45% 72% 420 Percentage of criminal cases with charges filed. 45% 43% 419 Percentage of criminal cases with individual defendants. 75% 90% 421 Percentage of conviction rate for criminal defendants. 85% 91% 400* Millions of pounds of air pollutants reduced, treated, or eliminated through concluded enforcement actions. 240 M lbs. 70 M lbs. 402* Millions of pounds of water pollutants reduced, treated, or eliminated through concluded enforcement actions. 200 M lbs. 130 M lbs 405 Millions of pounds of hazardous and non-hazardous wastes reduced, treated, or eliminated through concluded enforcement actions. 2,300 M lbs. 250 M lbs. 404* Millions of pounds of toxic and pesticide pollutants reduced, treated, or eliminated through concluded enforcement actions. 2.3 M lbs. 10.9 M lbs. 78 Percentage of all Superfund statute of limitations cases addressed at sites with unaddressed past Superfund costs equal to or greater than $500,000. 100% 98% 285 Percentage of Superfund sites having viable, liable responsible parties other than the federal government where EPA reaches a settlement or takes an enforcement action before starting a remedial action. 99% 100% 417 Millions of cubic yards of contaminated soil and groundwater media EPA has obtained commitments to clean up as a result of concluded CERCLA and RCRA corrective action enforcement actions. 200 M cu. yds. 400 M cu. yds. * GPRA measures 400, 402, and 404 respectively quantify pollutant releases that are or will be reduced, treated or eliminated to air, water, and land as a result of EPA enforcement actions. Measure 404 includes reductions of pollutant releases to land (e.g., RCRA non-hazardous waste, oil, gasoline, or solvents), as well as reductions in distribution of illegal products, including pesticides and new and existing chemicals.
Superfund Enforcement Results
- Cleanup Commitments
- Consistent with EPA’s renewed focus on Superfund cleanup, in FY 2017, private parties committed to spend more than $1.2 billion on new site cleanup. Responsible parties also agreed to reimburse $142.6 million of EPA’s past costs from clean up work at Superfund sites. Additionally, EPA billed parties $99 million for oversight.
- Annual totals for both cleanup and cost recovery settlements are often strongly influenced by the existence of one or two extremely large cases that involve complex cleanups.
- For example, FY 2011 was a record-setting year for the Superfund enforcement program as a result of the $2.1 billion Hudson River consent decree.
Superfund Results
 Notes
Notes
1. Totals include "allowed claims" under bankruptcy settlements.
2. These results do not include commitments made for activities at Federally-owned or operated facilities.
3. Prior FY dollars are adjusted to reflect current FY 2017 dollars based on the rate of inflation/deflation determined by the U.S. Department of Labor Consumer Price Index for All Urban Consumers.
4. Dollar figures referenced in the bullets are nominal values. They are not adjusted to reflect inflation/deflation.
* Amounts billed for Oversight were not reported as part of end-of-year results prior to FY 2010.
Data Source for Cleanup and Cost Recovery: FY16/17 Superfund Enterprise Management System (SEMS); FY14/15 Manual Reporting; FY07-FY13 Comprehensive Environmental Response, Compensation & Liability Information System (CERCLIS).
Data Source for Oversight: Compass Business Objects Reporting (CBOR)Superfund Results Fiscal Year
FY 2007*
FY 2008*
FY 2009*
FY 2010
FY 2011
FY 2012
FY 2013
FY 2014
FY 2015
FY 2016
FY 2017
Cost Recovery (millions)
$300
$264
$423
$173
$326
$184
$307
$60
$527
$56
$143
Oversight (millions)
$92
$81
$72
$97
$91
$109
$94
$99
Site Study & Cleanup (millions)
$817
$1,790
$2,274
$1,582
$3,289
$701
$1,305
$469
$2,034
$1,023
$1,227
Civil Enforcement Results
- Volume of Contaminated Soil and Water to be Cleaned Up
- In FY 2017, the Agency obtained commitments for remediation of an estimated 20.5 million cubic yards of contaminated soil and 412 million cubic yards of contaminated water as a result of CERCLA and RCRA Corrective Action enforcement.
- Annual totals of soil and water to be cleaned up are often strongly influenced by the existence of one or two extremely large cases.
- For example, in FY 2013 and FY 2014 three big cases accounted for the majority of the soil and water to be cleaned up.
Estimated Environmental Benefits - Volume of Contaminated Soil and Water to be Cleaned Up as a Result of CERCLA and RCRA Corrective Action
 Notes
Notes
1. EPA did not report volumes of soil and water to be cleaned up for CERCLA and RCRA Corrective Action cases as part of the end-of-year results prior to FY 2012.
2. The total volume includes commitments for actions at Federally-owned or operated facilities.
Data Source: Integrated Compliance Information System (ICIS)Estimated Environmental Benefits Volume of Contaminated Soil and Water to be Cleaned Up as a Result of CERCLA and RCRA Corrective Action Fiscal Year FY 2012 FY 2013 FY 2014 FY 2015 FY 2016 FY 2017 Contaminated Soil to be Cleaned Up (cubic yards in millions) 277 686 855 29 174 412 Contaminated Water to be Cleaned Up (cubic yards in millions) 140 66 15 37 17 21
Criminal Enforcement Results
- Value of Fines and Restitution and Court Ordered Environmental Projects
- In FY 2017, the total of criminal fines, restitution, and court ordered projects was $2.98 billion.
- Annual totals for criminal enforcement are often directly influenced by the existence of one or two extremely large cases.
- BP in FY 2013,
- Duke Energy in FY 2015, and
- Volkswagen in FY 2017.
- Criminal fines and restitution punish misconduct, deter other violators, and along with court ordered environmental projects, help to remedy the harm caused by the criminal conduct.
Value of Fines and Restitution and Court Ordered Environmental Projects
 Notes
Notes
1. All prior FY dollar figures in this report are adjusted to reflect the current value in FY 2017 dollars based on the monthly rate of inflation/deflation as determined by the U.S. Department of Labor Consumer Price Index for All Urban Consumers.
Data Source: Criminal Case Reporting SystemValue of Fines and Restitution and Court Ordered Environmental Projects Fiscal Year FY 2007 FY 2008 FY 2009 FY 2010 FY 2011 FY 2012 FY 2013 FY 2014 FY 2015 FY 2016 FY 2017 Value of Fines and Restitution (millions) $76 $72 $104 $46 $37 $47 $1,622 $65 $207 $216 $2,977 Value of Court Ordered Environmental Projects (millions) $162 $14 $11 $20 $2 $15 $3,226 $17 $4,058 $1 $3 - Environmental Crime Cases Opened, Defendants Charged and Sentencing Results – Years of Incarceration
- In FY 2017, the criminal program continued to focus on complex cases that involve a serious threat to human health and the environment or that undermine program integrity.
- Since FY 2013, there has been an increase in the years of incarceration due to renewable fuels fraud prosecutions.
Environmental Crime Cases Opened, Defendants Charged, and Sentencing Results (Years of Incarceration)
 FY 2007 – FY 2017") Data Source: Criminal Case Reporting System
Data Source: Criminal Case Reporting SystemCriminal Enforcement Environmental Crime Cases Opened, Defendants Charged, and Sentencing Results (Years of Incarceration) Fiscal Year FY 2007 FY 2008 FY 2009 FY 2010 FY 2011 FY 2012 FY 2013 FY 2014 FY 2015 FY 2016 FY 2017 # of Cases Opened 338 319 387 345 371 320 297 270 213 170 115 # of Defendants Charged 244 181 212 301 258 234 287 192 193 188 139 Sentencing (Years of Incarceration) 62 66 92 73 90 79 155 160 130 95 153
Civil Enforcement Results
- Estimated Value of Administrative and Civil Judicial Complying Actions (Injunctive Relief)
- In FY 2017, EPA enforcement actions required companies to invest nearly $20 billion in actions and equipment to control pollution (injunctive relief.)
- Annual totals for injunctive relief are often strongly influenced by the existence of one or two extremely large cases.
- In FY 2017, the actions with the largest injunctive relief investments include two Clean Air Act-Mobile Source settlements with Volkswagen ($15.9 billion in total injunctive relief).
- The large injunctive relief value achieved in FY 2011 includes the $5 billion TVA action.
Estimated Value of Administrative and Civil Judicial Complying Actions (Injunctive Relief)
 FY 2007 – FY 2017") Notes
Notes
1. Injunctive relief requires a regulated entity to perform, or refrain from performing, some designated action. It also brings the entity into compliance with environmental laws.
2. The total injunctive relief value reflects EPA enforcement actions, including Superfund cases involving Federally-owned or operated facilities.
3. All prior FY dollar figures in the graph are adjusted to reflect the current value in FY 2017 dollars based on the monthly rate of inflation/deflation as determined by the U.S. Department of Labor Consumer Price Index for All Urban Consumers.
4. Dollar figures referenced in the bullets are nominal values. They are not adjusted to reflect inflation/deflation.
Data Source: Integrated Compliance Information System (ICIS)Estimated Value of Administrative and Civil Judicial Complying Actions (Injunctive Relief) Fiscal Year FY 2007 FY 2008 FY 2009 FY 2010 FY 2011 FY 2012 FY 2013 FY 2014 FY 2015 FY 2016 FY 2017 Complying Action Vaule (billions) $12.5 $13.3 $6.1 $13.6 $20.8 $9.7 $7.7 $10.1 $7.8 $14 $20 - Hazardous Waste Treated, Minimized or Properly Disposed
- In FY 2017, EPA enforcement actions required companies to commit to treat, minimize, or properly dispose of an estimated 245 million pounds of hazardous waste.
- Annual totals for environmental benefits are often strongly influenced by the existence of one or two extremely large cases.
- In FY 2017, Municipality of Toa Alta committed to treat, minimize, or properly dispose of an estimated 199 million pounds of hazardous waste.
- In FY 2016, the IMC Phosphates Co. (Mosaic Fertilizer), a RCRA case, accounted for over 99% of the hazardous waste total of 62 billion pounds.
Estimated Environmental Benefits Hazardous Waste Treated, Minimized, or Properly Disposed
 Data Source: Integrated Compliance Information System (ICIS)
Estimated Environmental Benefits Hazardous Waste Treated, Minimized, or Properly Disposed Fiscal Year FY 2008 FY 2009 FY 2010 FY 2011 FY 2012 FY 2013 FY 2014 FY 2015 FY 2016 FY 2017 Pounds (millions) 6,542 779 11,751 3,563 4,368 148 711 535 61,900 245 - Commitments to Reduce, Treat or Eliminate Pollution
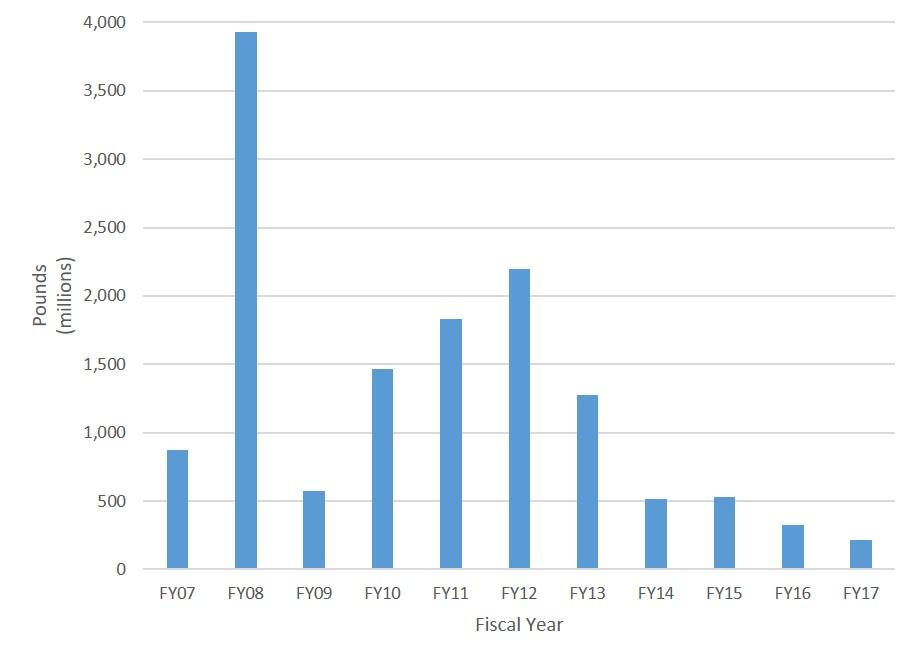
- In FY 2017, EPA enforcement actions required companies to commit to reduce, treat, or eliminate pollution by an estimated 217 million pounds per year.
- The estimated environmental benefits in past years came from largely conventional pollution emissions from coal fired power plants and municipal waste water systems. EPA addressed the largest of these systems first, so later cases in these sectors generally involved less pollution. In recent years we have increased our focus on reducing toxic pollution, which involves more toxic pollutants in smaller amounts.
Estimated Environmental Benefits Commitments to Reduce, Treat, or Eliminate Pollution (Air, Toxics, and Water)
 Notes
Notes
1. Pounds of hazardous waste reduced are not included in this Environmental Benefits graph. They are reflected on a separate graph.
Data Source: Integrated Compliance Information System (ICIS)Estimated Environmental Benefits Commitments to Reduce, Treat, or Eliminate Pollution (Air, Toxics, and Water)
Fiscal Year FY 2007 FY 2008 FY 2009 FY 2010 FY 2011 FY 2012 FY 2013 FY 2014 FY 2015 FY 2016 FY 2017 Pounds (millions) 871 3,931 574 1,466 1,832 2,195 1,276 515 533 324 217 - Administrative and Civil Judicial Penalties Assessed
- In FY 2017, EPA assessed nearly $1.6 billion in federal administrative and civil judicial penalties.
- Annual total penalties assessed are often strongly influenced by the existence of one or two extremely large cases.
- The FY 2017 results were dominated by the record- setting $1.45 billion Clean Air Act – Mobile Source penalty in the Volkswagen case.
- The large penalty value achieved in FY 2016 includes the $5.7 billion BP action.
Administrative and Civil Judicial Penalties Assessed
 Notes
Notes
1. All prior FY dollar figures in this report are adjusted to reflect the current value in FY 2017 dollars based on the monthly rate of inflation/deflation as determined by the U.S. Department of Labor Consumer Price Index for All Urban Consumers.
2. Dollar figures referenced in the bullets are nominal values. They are not adjusted to reflect inflation/deflation.
Data Source: Integrated Compliance Information System (ICIS)Administrative and Civil Judicial Penalties Assessed Fiscal Year FY07 FY08 FY09 FY10 FY11 FY12 FY13 FY14 FY15 FY16 FY17 Penalties Assessed (millions) $84 $144 $103 $116 $166 $221 $1,167 $103 $211 $5,911 $1,632
Other Civil Enforcement Results
- Federal Inspections and Evaluations
- In FY 2017, EPA conducted approximately 11,700 inspections/evaluations.
- Additional compliance monitoring activities conducted each year but not included on this graph, include, for example, inspections conducted by state and local agencies.
Federal Inspections and Evaluations (Conducted by EPA)
 FY 2007 – FY 2017") Data Source: Integrated Compliance Information System (ICIS), lCIS-NPDES, ICIS-AIR, RCRAInfo, and manual reporting.
Data Source: Integrated Compliance Information System (ICIS), lCIS-NPDES, ICIS-AIR, RCRAInfo, and manual reporting.Federal Inspections and Evaluations (Conducted by EPA)
Fiscal Year FY 2007 FY 2008 FY 2009 FY 2010 FY 2011 FY 2012 FY 2013 FY 2014 FY 2015 FY 2016 FY 2017 Total Inspections/Evaluations (thousands) 22 20 20 21 19 20 18 16 16 14 12 - Civil Enforcement Case Initiations and Conclusions
-
In FY 2017, EPA initiated more than 1,900 civil judicial and administrative cases, and concluded nearly 2,000 civil judicial and administrative cases.
Total Civil Enforcement Case Initiations and Conclusions
 Notes
Notes
1. Totals include CERCLA Initiations and Conclusions.
Data Source: Integrated Compliance Information SystemTotal Civil Enforcement Case Initiations and Conclusions
Fiscal Year FY 2007 FY 2008 FY 2009 FY 2010 FY 2011 FY 2012 FY 2013 FY 2014 FY 2015 FY 2016 FY 2017 Total Civil Initiations 3,762 3,726 3,779 3,436 3,283 3,027 2,418 2,278 2,378 2,414 1,938 Total Civil Conclusion 3,683 3,666 3,705 3,332 3,241 3,012 2,489 2,286 2,361 2,359 1,964 -
- Supplemental Environmental Projects
- In FY 2017, EPA enforcement settlements included voluntary agreements to undertake an estimated $17 million in Supplemental Environmental Projects (SEPs).
- Annual totals of the value of SEPs are often strongly influenced by the existence of one or two extremely large cases.
- FY 2009 includes $10 million in SEPs from the Memphis Light, Gas and Water case, and $6 Million in SEPs from a BP North America case.
- FY 2012 includes $20 million in SEPs from the BP Exploration case.
Supplemental Environmental Projects (SEPs)
 FY 2007 – FY 2017") Notes
Notes
1. SEPs are projects that are not otherwise legally required that have a close nexus to the violations and that a defendant/respondent agrees to undertake to benefit the community affected by the violations.
2. All prior FY dollar figures in this report are adjusted to reflect the current value in FY 2017 dollars based on the monthly rate of inflation/deflation as determined by the U.S. Department of Labor Consumer Price Index for All Urban Consumers.
3. Dollar figures referenced in the bullets are nominal values. They are not adjusted to reflect inflation/deflation.
Data Source: Integrated Compliance Information SystemValue of Fines and Restitution and Court Ordered Environmental Projects Fiscal Year FY 2007 FY 2008 FY 2009 FY 2010 FY 2011 FY 2012 FY 2013 FY 2014 FY 2015 FY 2016 FY 2017 Number of SEPs 184 188 150 119 103 124 110 100 122 107 94 Value of SEPs (millions) $36 $44 $47 $27 $28 $47 $23 $18 $40 $32 $17
Single Document Containing All Charts and Graphs
You may need a PDF reader to view some of the files on this page. See EPA’s About PDF page to learn more.- FY17 Enforcement Annual Results Data Graphs (PDF)(14 pp, 444 K, February 8, 2018)