 Treated Water Levels of Haloacetic Acids 5 (HAA5) for
Miami-Dade Water & Sewer Department
| REMINDER: Data Purpose: The ICR data were collected as part of a national research project to support development of national drinking water standards.
They should NOT be used to determine local water systems compliance with drinking water standards, nor should they be used to make personal judgements about individual health risks.
Units: Sample measurements are taken in micrograms per Liter (ug/L) and are regulated in milligrams per Liter (mg/L). A microgram per Liter is equivalent to one contaminant part per billion (ppb). A ppb can be thought of as one grain of salt in a swimming pool. Data for Total Trihalomethanes, haloacetic acids 5, and bromate are presented in ppb. 1 mg/L = 1000 ug/L, or 0.080 mg/L = 80 ug/L = 80 ppb, which happens to be the TTHM standard in the Stage 1 DBP Rule. Results of Zero: A result of zero may indicate that a sample was analyzed, but that the result was less than the lowest value that the analytical method can reliably report. |
Treated Water Levels of HAA5 for Alexander Orr, Jr Water T. Plant
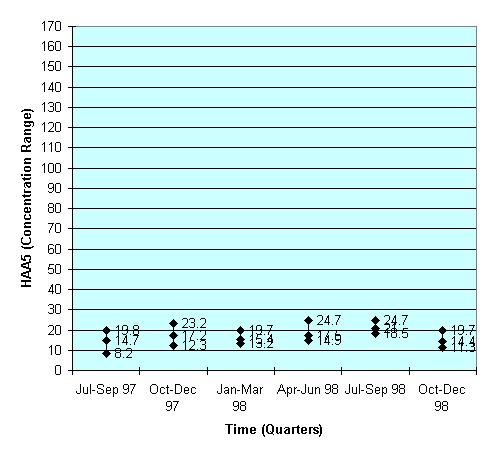
| Water Type | Quarter | Avg(HAA5) Concentration (ppb) | Min(HAA5) Concentration (ppb) | Max(HAA5) Concentration (ppb) |
|---|---|---|---|---|
| Ground Water | JUL 1997 - SEP 1997 | 14.7 | 8.2 | 19.8 |
| Ground Water | OCT 1997 - DEC 1997 | 17.2 | 12.3 | 23.2 |
| Ground Water | JAN 1998 - MAR 1998 | 15.4 | 13.2 | 19.7 |
| Ground Water | APR 1998 - JUN 1998 | 17.5 | 14.9 | 24.7 |
| Ground Water | JUL 1998 - SEP 1998 | 21 | 18.5 | 24.7 |
| Ground Water | OCT 1998 - DEC 1998 | 14.4 | 11.3 | 19.7 |
Treated Water Levels of HAA5 for John E. Prest on Water Treatment Plant
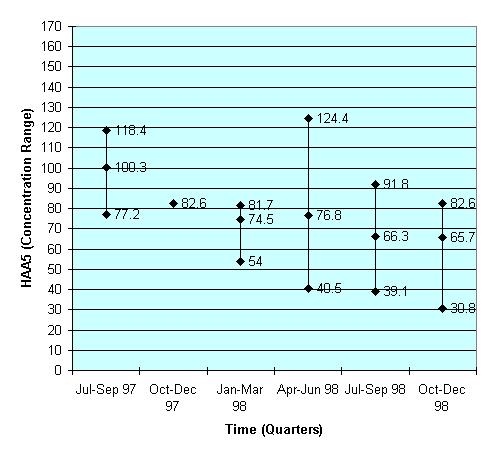
| Water Type | Quarter | Avg(HAA5) Concentration (ppb) | Min(HAA5) Concentration (ppb) | Max(HAA5) Concentration (ppb) |
|---|---|---|---|---|
| Ground Water | JUL 1997 - SEP 1997 | 100.3 | 77.2 | 118.4 |
| Ground Water | OCT 1997 - DEC 1997 | 82.6 | 82.6 | 82.6 |
| Ground Water | JAN 1998 - MAR 1998 | 74.5 | 54 | 81.7 |
| Ground Water | APR 1998 - JUN 1998 | 76.8 | 40.5 | 124.4 |
| Ground Water | JUL 1998 - SEP 1998 | 66.3 | 39.1 | 91.8 |
| Ground Water | OCT 1998 - DEC 1998 | 65.7 | 30.8 | 82.6 |
Treated Water Levels of HAA5 for Hialeah Water Treatment Plant
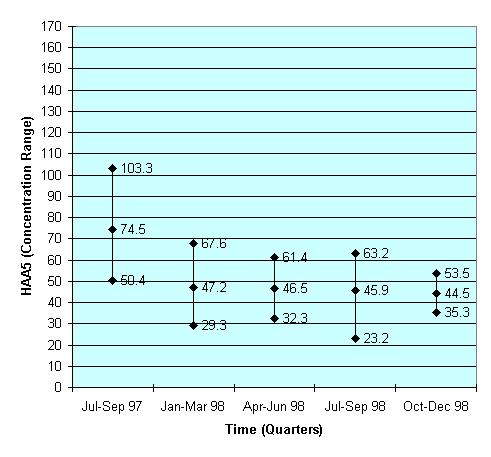
| Water Type | Quarter | Avg(HAA5) Concentration (ppb) | Min(HAA5) Concentration (ppb) | Max(HAA5) Concentration (ppb) |
|---|---|---|---|---|
| Ground Water | JUL 1997 - SEP 1997 | 74.5 | 50.4 | 103.3 |
| Not Reported | OCT 1997 - DEC 1997 | NO DATA | NO DATA | NO DATA |
| Ground Water | JAN 1998 - MAR 1998 | 47.2 | 29.3 | 67.6 |
| Ground Water | APR 1998 - JUN 1998 | 46.5 | 32.3 | 61.4 |
| Ground Water | JUL 1998 - SEP 1998 | 45.9 | 23.2 | 63.2 |
| Ground Water | OCT 1998 - DEC 1998 | 44.5 | 35.3 | 53.5 |
Treated Water Levels of HAA5 for South Dade System
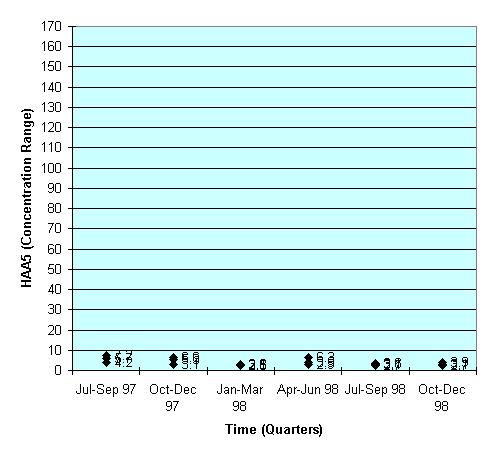
| Water Type | Quarter | Avg(HAA5) Concentration (ppb) | Min(HAA5) Concentration (ppb) | Max(HAA5) Concentration (ppb) |
|---|---|---|---|---|
| Ground Water | JUL 1997 - SEP 1997 | 5.7 | 4.2 | 7.2 |
| Ground Water | OCT 1997 - DEC 1997 | 5.3 | 3.1 | 6.6 |
| Ground Water | JAN 1998 - MAR 1998 | 2.8 | 2.5 | 3.1 |
| Ground Water | APR 1998 - JUN 1998 | 3.9 | 2.9 | 6.3 |
| Ground Water | JUL 1998 - SEP 1998 | 3.1 | 2.7 | 3.6 |
| Ground Water | OCT 1998 - DEC 1998 | 3.1 | 2.7 | 3.9 |
How does this utility's treated water compare to treated waters nationally for Haloacetic Acids 5? Click on "view report" to see the state and national levels of Haloacetic Acids 5.
| Quarter | State Report | National Report |
|---|---|---|
| JUL - SEP 1997 | view report | view report |
| OCT - DEC 1997 | view report | view report |
| JAN - MAR 1998 | view report | view report |
| APR - JUN 1998 | view report | view report |
| JUL - SEP 1998 | view report | view report |
| OCT - DEC 1998 | view report | view report |
 ICR Overview
Envirofacts Home Page
ICR Overview
Envirofacts Home Page