Clear Skies
Clear Skies in Nevada
Highlights of Clear Skies in Nevada

- Nevada sources would reduce emissions of SO2 by 19%, NOx by 39%, and mercury by 36% by 2020 due to Clear Skies.
- The health benefits in the West would total $8.6 billion annually
($1.6 billion under the alternative estimate) and include approximately
1,100 fewer premature deaths (600 under the alternative estimate)
and 2,500 fewer hospitalizations/emergency room visits each year.
Note: For the purposes of this analysis, the West includes all states that would be affected by the Zone 2 cap for NO x under Clear Skies. These states are WA, OR, CA, UT, AZ, ID, MT, WY, CO, NM, TX, OK, KS, NE, ND, and SD.
- In addition, Western states would continue to enjoy good visibility and the other benefits of a clean environment even in the face of increasing demand for electricity.
- Clear Skies does not significantly impact electricity prices. With or without Clear Skies, electricity prices in the electricity supply region that includes Nevada are expected to remain below 2000 national average prices.
Clear Skies: An Innovative Approach to Improving Human Health and the Environment
Why Clear Skies
- Air quality has improved, but serious concerns persist
- Nevada's citizens suffer ill effects from air pollution, including asthma attacks and premature death
- Electricity generation sector remains a major emissions source
- Very cost-effective to control the power sector, relative to other sources
- Sources are concerned about upcoming complex and burdensome regulations
Advantages of the Clear Skies Approach
- Guarantees significant nationwide emissions reductions - beginning
years before full implementation
- Nevada sources would reduce or hold the line on emissions of SO2, NOx, and mercury
- Delivers dramatic progress towards achievement of critical health and environmental goals
- Uses proven, market-based flexible approach with incentives
for innovation
- Recognizes environmental needs as well as industry constraints, allowing industry to better manage its operations and finances while lowering risks to the public
- Sources are projected to install pollution controls to enable continued reliance on coal
- Increases certainty across the board for industry, regulators, and consumers
Under Current Clean Air Act Power Plants Would Face a Complex Set of Requirements
Clear Skies Sets a Firm Timeline for Emission Reductions
| The existing Title IV SO2 cap-and-trade program provides an incentive and a mechanism to begin reductions upon enactment of Clear Skies years before regulatory action under the current Act. |
2004: The NOx SIP call (summertime NOx cap in 19 Eastern States + D.C.)
2008: Clear Skies NOx Phase I (2.1 million ton annual cap assigned to two Zones with trading programs)
2010:
- Clear Skies Hg Phase I (26 ton annual cap with a national trading program)
- SO2 Phase I (4.5 million ton annual cap with a national trading program)
2018:
- Clear Skies NOx Phase II (1.7 million ton annual cap assigned to two Zones with trading programs)
- Clear Skies Hg Phase II (15 ton annual cap with a national trading program)
- Clear Skies SO2 Phase II (3.0 million ton annual cap with a national trading program)
Clear Skies Builds Upon the Work of the WRAP
- Clear Skies is designed to support the WRAP goals and process;
in addition to a national constraint on SO2, the bill ensures
that the WRAP's emissions reduction goal for nine states is achieved:
- If for any reason the regional reduction goal set by the
WRAP for 2018 (271,000 tons for the power sector) is not achieved,
a separate WRAP cap-and-trade program is triggered to ensure
that the regional reductions are preserved.
- This special cap-and-trade program is based on the framework established in the WRAP process.
- This special cap can also be triggered by 2013 if States determine there is sufficient evidence that the target will not be met by 2018.
- If for any reason the regional reduction goal set by the
WRAP for 2018 (271,000 tons for the power sector) is not achieved,
a separate WRAP cap-and-trade program is triggered to ensure
that the regional reductions are preserved.
Note: Yellow states are states involved in the WRAP voluntary emissions reduction program.
The West Faces Unique Challenges
- Environmental effects of power plant emissions - including visibility
impairment and acid deposition - are broadly distributed
- Increasing ground-level ozone concentrations in national parks
- Particle-related haze in national parks and wilderness areas
- Nitrogen deposition in high elevation ecosystems (e.g., Colorado Front Range)
- Brown clouds in major cities
- Few western nonattainment areas are due to stationary source emissions

As the West Grows, Clear Skies Protects Human Health and the Environment
The West Will Continue to Grow... 
- Population is projected to grow more than 20% from current levels by 2020
- Electricity demand is expected to grow more than the national
average
- More than 10% over national average in the Pacific States
- More than 30% over national average in the Mountain States
...While the Environment Is Protected
- Clear Skies would protect air quality by lowering or halting
increases in air emissions throughout the West from today's levels:
- Prevent degradation of visibility in parks.
- Help counties remain in attainment with health-based air quality standards, reducing the burden on state and local governments.
- Ensure nitrogen deposition does not increase and reduce mercury deposition.
Emissions in Nevada under Clear Skies
Emissions in Nevada (2020) would be reduced from 2000 levels:
|
Emissions: Existing Clean Air Act Regulations (base case*) vs. Clear Skies in Nevada in 2010 and 2020
SO2 and NOx Emissions Reductions under Clear Skies
Note: The base case in IPM includes Title IV, the NOx SIP Call, NSR settlements, and state-specific caps in CT, MA, MO, NC, NH, TX, and WI. It does not include mercury MACT in 2007 or any other potential future regulations to implement the current ambient air quality standards or other parts of the Clean Air Act. Base case emissions in 2020 will likely be lower due to state and federal regulatory actions that have not yet been promulgated. Emissions projected for new units in 2020 are not reflected.
Clear Skies Health and Air Quality Benefits in the Nevada
| By 2020, the West would receive approximately $8.6 billion in annual health benefits from reductions in fine particle and ozone concentrations alone due to Clear Skies. (see note 1) |
- Reduced ozone and fine particle exposure by 2020 would result
in public health benefits of:
- approximately 1,100 fewer premature deaths each year (see note 1)
- approximately 800 fewer cases of chronic bronchitis each year
- approximately 1,800 fewer non-fatal heart attacks each year
- approximately 2,500 fewer hospital and emergency room visits each year
- Approximately 150,000 fewer days workers are out sick due to respiratory symptoms each year
- approximately 19,000 fewer school absences each year
- Reduced mercury emissions would reduce exposure to mercury through consumption of contaminated fish, resulting in additional, unquantified benefits to those who eat fish from mercury contaminated lakes and streams in the West.
Help Maintain Health- Based Air Quality Standards (see note 2)
- All counties in Nevada are currently expected to meet the 8-hour ozone and fine particle standards.
- Clear Skies would reduce concentrations of ozone and fine particles throughout Nevada, providing additional benefits to public health.
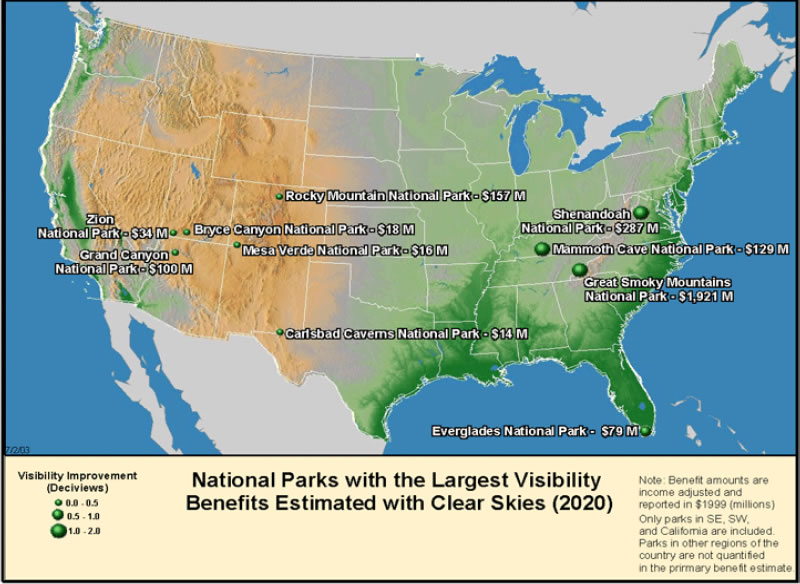
Clear Skies Would Provide Important Environmental Benefits in the West
Clear Skies would produce significant visibility benefits in highly visited national parks and wilderness areas in the West.
- Quantifiable visibility benefits in just 5 parks (Grand Canyon, Rocky Mountain, Zion, Bryce Canyon, and Mesa Verde National Parks) total over $300 million.
- Visibility benefits in the Grand Canyon alone are estimated to be $100 million annually by 2020.
- Visibility improvements are also projected to improve tourism.
- In comparison to existing programs, nitrogen deposition would decrease by 5-20% in the intermountain West, and in some areas, such as the Four Corners region, by up to 35%. Sulfur and mercury deposition would not increase despite growth in electricity demand.
Electricity Generation in Nevada under Clear Skies
Current and Projected Generation by Fuel Type in Nevada under Clear Skies (GWh)
|
Nevada's sources are projected to reduce their emissions through the installation of emission controls, rather than through a switch from coal to natural gas. In 2010, 82% of Nevada's coal-fired generation is projected to come from units with advanced SO2 and/ or NOx control equipment that also substantially reduce mercury emissions; in 2020, the percentage is projected to increase to 83% |
Emission Controls in Nevada under Clear Skies
Units in Nevada Projected to Be Retrofitted Due to Clear Skies by 2020
Notes: 1. Retrofits and total coal-fired capacity apply to coal units greater than 25 MW. 2. Mohave units 1 and 2 are projected to be removed from operation by 2005 with Clear Skies due to excess gas-fired capacity in the marketplace, unless otherwise needed for voltage purposes. The majority owner of the plant has indicated that the plant will be removed from service by 2006 anyway. The recent overbuild of gas-fired generation reduces the need for less efficient units operating at lower capacity factors. These units are inefficient compared to other coal-fired plants and newer gas-fired generation. Less conservative assumptions regarding natural gas prices or electricity demand would create a greater incentive to keep these units operational. Electricity Prices in Nevada under Clear Skies
Note: The base case using IPM includes Title IV, the NO x SIP Call, NSR settlements, and state- specific caps in CT, MA, MO, NC, NH, TX, and WI. It does not include mercury MACT in 2007 or any other potential future regulations to implement the current ambient air quality standards or other parts of the Clean Air Act. Base case emissions in 2020 will likely be lower due to state and federal regulatory actions that have not yet been promulgated. Costs and Benefits in Nevada under Clear Skies
Benefits Outweigh the Costs
Notes on EPA's Analysis
1. An alternative methodology for calculating health-related benefits projects approximately 600 premature deaths prevented and $1.6 billion in health benefits each year in the West by 2020. 2. Based on 1999-2001 data for counties with monitors that have three years of complete data. |
|||||||||||||||
