Clear Skies
Clear Skies in Massachusetts
Highlights of Clear Skies in Massachusetts
 Massachusetts
already has in place state requirements that will substantially
reduce emissions of SO2 and NOx in the State.
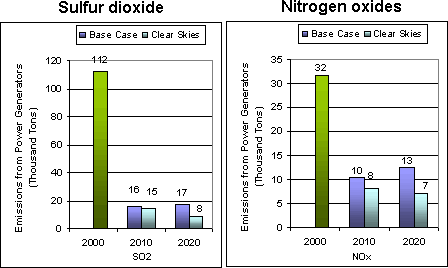
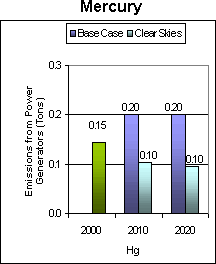
 - Clear Skies achieves additional emission reductions in Massachusetts, particularly for mercury; sources would reduce emissions of SO2 by 51%, NOx by 43%, and mercury by 52% by 2020 due to Clear Skies.
- The health benefits in Massachusetts would total $1.8 billion ($340 million under the alternative estimate) and include for the New England region 500 fewer premature deaths (290 fewer premature deaths under the alternative estimate) and 860 fewer hospitalizations/emergency room visits each year.
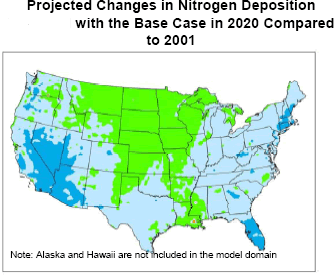
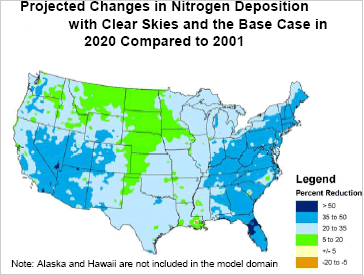
- In addition, Massachusetts would receive significant environmental benefits, including reductions in nitrogen deposition that would benefit estuarine waterways.
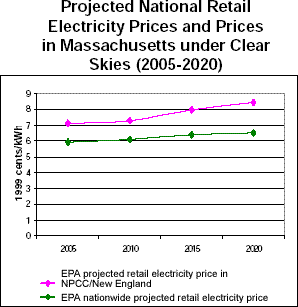
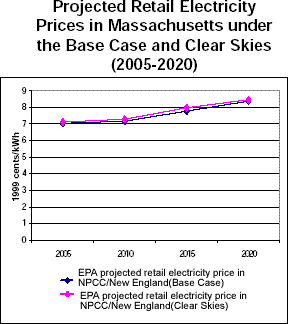
- Clear Skies does not significantly impact electricity
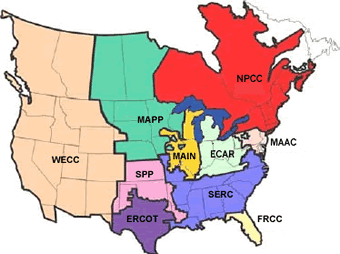
prices. With or without Clear Skies, electricity prices
in the electricity supply region that includes Massachusetts
are expected to remain below 2000 prices.
Clear Skies: An Innovative Approach to Improving Human
Health and the Environment
Why Clear Skies?
- Air quality has improved, but serious concerns persist
- Massachusetts’s citizens suffer ill effects from air pollution, including asthma attacks and premature death
- Electricity generation sector remains a major emissions
source
- Very cost-effective to control the power sector, relative
to other sources
- Sources are concerned about upcoming complex and burdensome regulations
- Very cost-effective to control the power sector, relative
to other sources
Advantages of the Clear Skies Approach
- Guarantees significant nationwide emissions reductions
– beginning years before full implementation
- Massachusetts sources would substantially reduce emissions of SO2 and NOx
- Delivers dramatic progress towards achievement of critical health and environmental goals
- Uses proven, market-based flexible approach with incentives
for innovation
- Recognizes environmental needs as well as industry constraints, allowing industry to better manage its operations and finances while lowering risks to the public
- Sources are projected to install pollution controls to enable continued reliance on coal
- Increases certainty across the board for industry, regulators,
and consumers
Under Current Clean Air Act Power Plants Would Face a Complex Set of Requirements
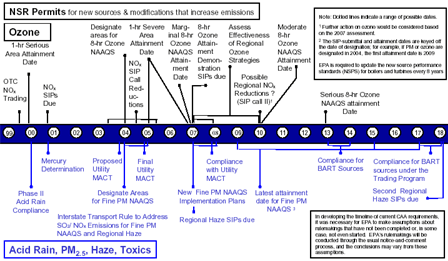
For a larger image, click here.
Clear Skies Sets a Firm Timeline for Emission Reductions
| The existing Title IV SO2 cap-and-trade program provides an incentive and a mechanism to begin reductions upon enactment of Clear Skies years before regulatory action under the current Act. |
2004: The NOx SIP call (summertime NOx cap in 19 Eastern States + D.C.)
2008: Clear Skies NOx Phase I (2.1 million ton annual cap assigned to two Zones with trading programs)
2010:
- Clear Skies Hg Phase I (26 ton annual cap with a national trading program)
- SO2 Phase I (4.5 million ton annual cap with a national trading program)
2018:
- Clear Skies NOx Phase II (1.7 million ton annual cap assigned to two Zones with trading programs)
- Clear Skies Hg Phase II (15 ton annual cap with a national trading program)
- Clear Skies SO2 Phase II (3.0 million ton annual cap with a national trading program)
Emissions in Massachusetts under Clear Skies
Emissions in Massachusetts (2020) would
be significantly reduced from 2000 levels:
These reductions are mostly attributable to the state
regulation, with the exception of mercury, which is
reduced by an additional 50% beyond what Massachusetts’
rule would achieve in 2020. |
Emissions: Current (2000) and Existing Clean Air Act Regulations (base case*) vs. Clear Skies in Massachusetts in 2010 and 2020
|
| Note: The base case using IPM includes Title IV, the NOx SIP Call, NSR settlements, and state-specific caps in CT, MA, MO, NC, NH, TX, and WI. It does not include mercury MACT in 2007 or any other potential future regulations to implement the current ambient air quality standards or other parts of the Clean Air Act. Base case emissions in 2020 will likely be lower due to state and federal regulatory actions that have not yet been promulgated. |
Clear Skies Health and Air Quality Benefits in Massachusetts
Improve Public Health
| By 2020, Massachusetts would receive approximately $1.8 billion in annual health benefits from reductions in fine particle and ozone concentrations alone due to Clear Skies (see note 1). |
Reduced ozone and fine particle exposure by 2020 would result
in public health benefits of:
- approximately 200 fewer premature deaths each year (see note 1)
- approximately 100 fewer cases of chronic bronchitis each year
- approximately 500 fewer non-fatal heart attacks each year
- approximately 400 fewer hospital and emergency room visits each year
- approximately 26,000 fewer days workers are out sick due to respiratory symptoms each year
- approximately 2,000 fewer school absences each year
Reduced mercury emissions would reduce exposure
to mercury through consumption of contaminated fish, resulting
in additional, unquantified benefits to those who eat fish
from Massachusetts’ lakes and streams.
Help Maintain Health-Based Air Quality Standards
- All counties in Massachusetts currently meet the fine particle standard; all but seven counties currently meet the 8-hour ozone standard. (see note 2)
- All 7 counties that currently exceed the ozone standard (population over 4 million) would be brought into attainment with the ozone standard under existing programs by 2010.
- Clear Skies would provide additional reductions in concentrations of ozone and fine particles in counties throughout Massachusetts.
Emission Reductions under Clear Skies
| Emissions in states surrounding Massachusetts would decrease considerably. These emission reductions would make it much easier for Massachusetts to comply with the national air quality standards. |
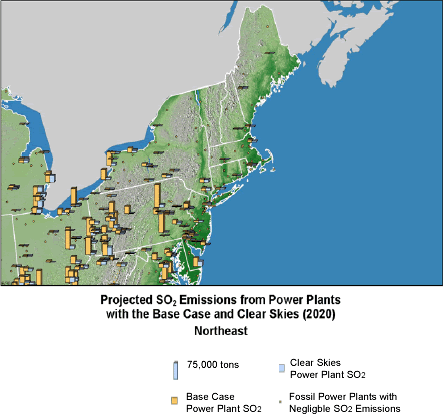
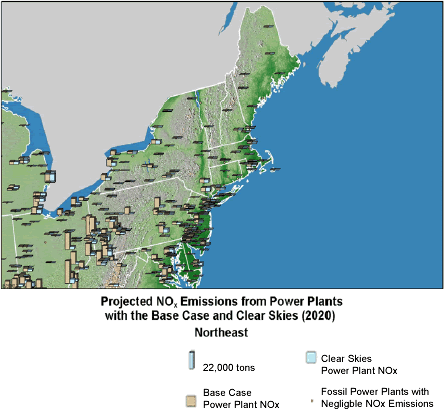
Note: The base case in IPM includes Title IV, the NOx SIP Call, NSR settlements, and state-specific caps in CT, MA, MO, NC, NH, TX, and WI. It does not include mercury MACT in 2007 or any other potential future regulations to implement the current ambient air quality standards or other parts of the Clean Air Act. Base case emissions in 2020 will likely be lower due to state and federal regulatory actions that have not yet been promulgated. Emissions projected for new units in 2020 are not reflected.
Clear Skies Environmental Benefits in Massachusetts
Clear Skies Would Provide Substantial Environmental Benefits in Massachusetts
In comparison to existing programs,
- Visibility would improve perceptibly in coastal areas
of Massachusetts.
- The value of improved visibility for Massachusetts
residents who visit National Parks and Wilderness areas
nationwide would be $66 million each year by 2020.
- The value of improved visibility for Massachusetts
residents who visit National Parks and Wilderness areas
nationwide would be $66 million each year by 2020.
- Nitrogen deposition, a cause of damage in nitrogen-sensitive
coastal waters, would be reduced in coastal waters and surrounding
watersheds by up to 20% beyond what is expected under the
Base Case.
- Sulfur deposition, a primary cause of acid rain, would
decrease by 15-30% across most of Massachusetts.
- Mercury deposition would decrease by up to 5% across most the state, and up to 15% along the western border.*
* These results are based on modeling the Clear Skies mercury cap without the safety valve.
Electricity Generation in Massachusetts under Clear Skies
|
Massachusetts’s sources are projected to reduce their emissions through the use of existing pollution controls, rather than through a switch from coal to natural gas.
|
Current and Projected Generation by Fuel
Type in Massachusetts under Clear Skies (GWh) 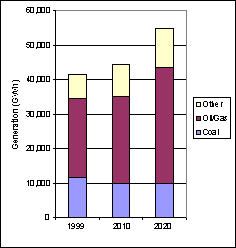 |
|
|
Notes: |
Electricity Prices in Massachusetts under Clear Skies
|
|
Note: The base case using IPM includes Title IV, the NOx SIP Call, NSR settlements, and state-specific caps in CT, MA, MO, NC, NH, TX, and WI. It does not include mercury MACT in 2007 or any other potential future regulations to implement the current ambient air quality standards or other parts of the Clean Air Act. Base case emissions in 2020 will likely be lower due to state and federal regulatory actions that have not yet been promulgated. |
Costs and Benefits in Massachusetts under Clear Skies
Benefits Outweigh the Costs
|
Clear Skies….
|
- In Massachusetts, economic modeling projects that the cost of generating electricity, of which a component is the cost of installing and operating pollution controls, is less under Clear Skies than under the base case as power production shifts within the region to enable the power sector to comply in the most cost-effective manner. Total annual health benefits in 2020 for Massachusetts are projected to be $1.8 billion.
- Nationwide, the projected annual costs of Clear Skies
(in $1999) are $4.3 billion in 2010 and $6.3 billion in
2020; the nationwide benefits of Clear Skies are expected
to be over $113 billion annually by 2020
- An alternate estimate projects annual health benefits totaling $23 billion
Note: Costs include capital
costs, fuel, and other operation and maintenance costs (both
fixed and variable) associated with the achievement of the
emissions caps in the legislation (for example, the installation
and operation of pollution controls). These state-level production
costs are estimates; they do not account for the costs associated
with the transfer of electricity across regions, nor the costs
or savings that could be associated with allowance movement
between sources.
Notes on EPA's Analysis
-
The information presented in this analysis reflects EPA's modeling of the Clear Skies Act of 2003.
- EPA has updated this information to reflect modifications:
- Changes included in the Clear Skies Act of 2003.
- Revisions to the Base Case to reflect newly promulgated rules at the state and federal level since the initial analysis was undertaken.
- The Clear Skies modeling results presented include
the safety valve feature
- EPA has updated this information to reflect modifications:
-
This analysis compares new programs to a Base Case (Existing Control Programs), which is typical when calculating costs and benefits of Agency rulemakings.
- The Base Case reflects implementation of current
control programs only:
- Does not include yet-to-be developed regulations
such as those to implement the National Ambient
Air Quality Standards.
- Does not include yet-to-be developed regulations
such as those to implement the National Ambient
Air Quality Standards.
- The EPA Base Case for power sector modeling includes:
- Title IV, the NOx SIP Call, NSR settlements, and state-specific caps in Vermont, Massachusetts, Missouri, North Carolina, Texas, and Wisconsin finalized before March 2003.
- For air quality modeling, the Base Case also includes federal and state control programs, as well as the Tier II, Heavy Duty Diesel, and Non-Road Diesel rules.
- The Base Case reflects implementation of current
control programs only:

1. An alternative methodology for calculating health-related benefits projects approximately 100 premature deaths prevented and $340 million million in health benefits each year in Massachusetts by 2020.
2. Based on 1999-2001 data of counties with monitors that have three years of complete data.
|
State information based on EPA's modeling of the Clear Skies Act of 2002 is presented here for archival reasons.
|

