EPA On-line Tools for Site Assessment Calculation
Travel Time and Site History
We'll now specifically look for times in the site history that give a clue for beginning and ending dates of the release:
This station had three 6,000 gallon underground storage tanks. During relining of the tanks in February, 1993, hydrocarbon odors were detected in the ground and an investigation was triggered.
There's no neon sign pointing to the release dates here, but lets use this information to see what would happen if a release occurred in February 1993.
When would a concentration above the threshold of 5 mg/l first arrive at a receptor?
We have not yet looked at one parameter needed to estimate the travel time: the Hydraulic Conductivity. From the report:
| Test |
Value |
| Slug Test |
8.72 ft/day |
| Pump Test |
2.88 ft/day |
|
|
| Test |
Value |
| |
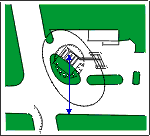
| We need a distance to a receptor. We'll pick the distance to the downgradient edge of the street. This is about 140 feet from the center of the tank pit. The idea here is to see how long it takes benzene to move from the center of the tank pit to the edge of the street. |

|
We need the parameters we revised using OnSite:
|
OnSite Revised Parameter Values
|
| Parameter |
Revised value |
| bulk density |
1.72 g/cm3
|
| retardation factor for benzene |
1.04 to 1.4 |
|
|
We can now add an estimate of the concentration at our receptor point, which requires additional parameters. The arrival time will be determined because this is the way to incorporate advection, degradation, dispersion, and source strength into an arrival time calculation.
| Parameter |
Value |
| Source concentration |
40 mg/l |
| Source duration |
1825 days (5 years) |
| Half Life |
1277 days |
|
|
Other parameters: the simulation requires a duration which is set to 5 years, so that the source is active throughout the simulation. This provides a constant input to the aquifer during the lifetime of the simulation.
|
|


