Modeling Subsurface Petroleum Hydrocarbon Transport
| Module Home Objectives Table of Contents Previous < Next > |
| 14 of 22 |

Click image to see more |
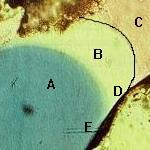
A photomicrograph of a simulated three phase system with a blue non-wetting phase ("A"), a clear intermediate phase ("B"), and a pink ("C") wetting phase. For clarity a thin black line separates the intermediate and wetting phases. The pink ("C") wetting phase can be seen to be drawn into the intermediate phase ("B") along the sand grain ("D"). Similar behavior occurred between the intermediate phase ("B") and the non-wetting phase ("A") at point "E". These similarities illustrate that wetting is relative. The wetting phase represents water, the non-wetting phase represents air, and the intermediate phase represents fuel, a solvent or other water-immiscible liquid (creosote, crude oil, or a mixture of several). The pollutant in this three-liquid phase system is now occupying a film between the water and air. In this case the film is fairly thick. |

Click image to see more |
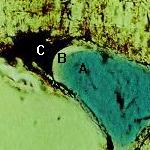
Another simulated three phase system with a blue non-wetting phase ("A"), a clear intermediate phase ("B"), and a dark ("C") wetting phase. The pollutant in this three-liquid phase system is now occupying a thin film between the water and air. The full-size photograph shows that the intermediate phase (pollutant) surrounds the non-wetting phase, which is partly the reason for its thinness relative to the previous example. This situation is similar to the three-phase distribution in glass beads illustrated by Dr. Schwille. |
Home | Glossary | Notation | Links | References | Calculators |
