Pacific Southwest, Region 9
Serving: Arizona, California, Hawaii, Nevada, Pacific Islands, Tribal Nations

Summary
EPA announced that it rejected Arizona’s claim that dust storms caused the high pollution readings in Phoenix in 2008, a decision which could have significant implications for the State.
Photos
Images taken by ADEQ cameras from locations with Phoenix.
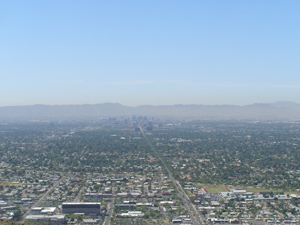
Larger version
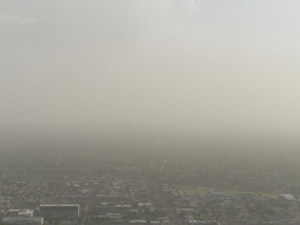
Larger version
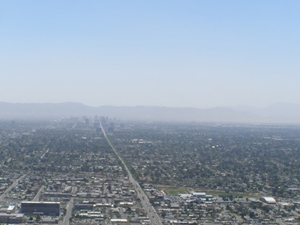
Larger version
Graphs
Phoenix on a normal, low pollution day.
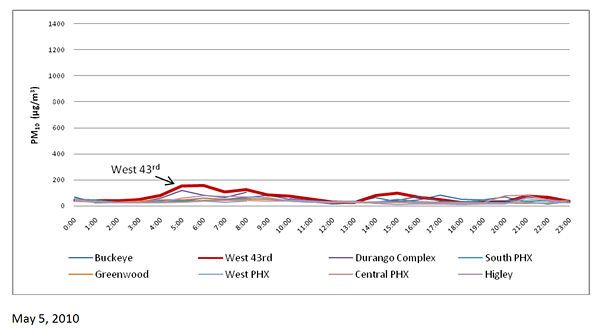
This chart shows the air pollution readings for Phoenix on a normal, low pollution day. The x-axis is hours of the day. The y-axis is the concentration of coarse particulate matter expressed in micrograms per cubic meter. Measurements from different monitors in Phoenix are shown in different colors. The monitor at W. 43rd Ave is highlighted.
Phoenix during a dust storm.
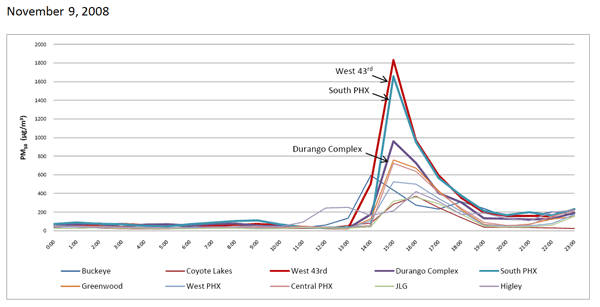
This chart shows the air pollution readings for a day where the photos and the data indicate a regional dust storm effected air quality in Phoenix. Note how all of the monitors are impacted by the storm.
High Concentrations at W. 43rd
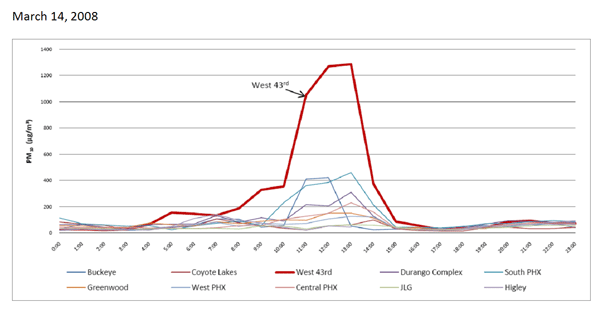
This chart shows a day where the Arizona Department of Environmental Quality has claimed that the air pollution measurements should be excluded from consideration under the Exceptional Events Rule. Note the very high concentrations at W. 43rd while the other monitors are relatively unaffected. This is not consistent with a regional dust storm. We've noted that PM10 levels at W. 43rd often begin to rise at the same time as the nearby industrial facilities begin their work day. An Arizona State University analysis noted that these exceedances are much more likely to occur on weekdays than on weekends.
| Pacific Southwest NewsroomPacific Southwest Programs | Grants & FundingUS-Mexico Border | Media Center Careers | About EPA Region 9 (Pacific Southwest)A-Z Index |
