Indiana Harbor Canal
You will need the free Adobe Reader to view the files on this page. See EPA's PDF page to learn more.
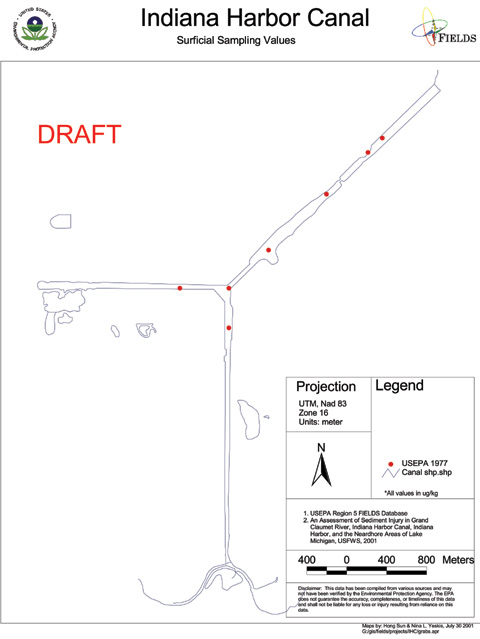
Figure 1
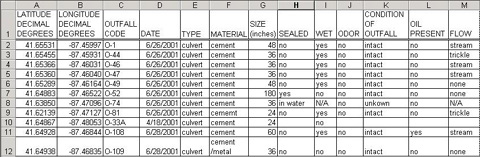
Figure 2
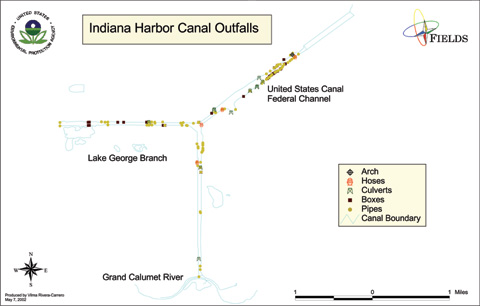
Figure 3
The Indiana Harbor Canal (IHC) is located in the Northwest corner of the State of Indiana within the cities of East Chicago and Hammond. It is a manmade canal formed in the shape of a Y with the Lake George Branch running east west, the Indiana Harbor Branch running north south and the United States Branch running southwest to northeast into lake Michigan. The canal was built to service the industrial corridor between the Grand Calumet River and Lake Michigan. It was designed for use by the petroleum-based heavy industry that has been in the area since the 1880’s. It is one of the oldest heavy industry corridors in the country.
The Indiana Harbor Canal project had two main goals. The first Goal was to conduct a data quality study of all historical sediment contamination studies containing the canal area from 1977 to 2001. Once the data was checked, maps of the spatial extent of all contaminants of concern were developed. Goal 2 was centered on an outfall study. The first objective of this study was to locate (using Global Positioning Survey equipment) and to characterize any potential recontamination conduit. Once these outfalls were located and described, the outfalls were matched with NPDES permits.
To achieve the first Goal of this project a master database was established. From this database, maps of the eight contaminants of concern (COC); arsenic, cadmium, chromium, dioxin, lead, oil & grease, polychlorinated biphenyl’s (PCB’s) and polycyclic aromatic hydrocarbons (PAH’s), identified by the project manager, were generated. Maps depict the position and value of the contaminant for each study in which it appeared.
Also, a map was created for each COC listing all known values and positions for the years 1977-2001. FIELDS then reviewed the data with the aim of using statistical analysis to interpolate contaminant trends. Unfortunately, many of the studies contained only a few data points in the canal itself. In studies were there were more data points in the canal, the data were not spatially correlated and no trends could be analyzed. Figure 1 is an example of one of these maps.
On your right, you can see Figure 1 (PDF) (1 pg, 831K, About PDF). This is a map of the outline of the Indiana Harbor canal. Within the borders of the canal are seven non-uniformly spaced dots representing sample locations from the U.S. EPA 1977 Sediment Sampling Project.
To achieve the second Goal of this project, an Outfall Study was carried out at the IHC to locate and characterize any potential large-scale contaminant pathways. Each potential outfall’s location was GPS’ed , a picture of the outfall was taken and a list of attributes was obtained. Some of the attributes were: approximate size, condition, presence or absence of flow, description of flow or odor, presence or absence of oil, etc. This data were entered into an electronic database and maps depicting the spatial placement of these outfalls along the canal were generated. Figure 2 shows a portion of the database. Figure 3 shows the map of all known culverts along IHC.
Figure 2 (on your right) is a portion of the database displayed as a table. It shows the attributes for 12 outfalls. The attributes shown are latitude, longitude, date, type, material, size, sealed, wet, odor, condition, oil, and flow.
Figure 3 is a map of the outline of the Indiana Harbor Canal (poster 16.50 x 10.50 inches, 1.08MB, About PDF). Within the borders of the canal are symbols denoting the spatial distribution of all potential outfalls along the sides of the canal.
The final objective in Goal 2 was to match these outfalls with all known permitted outfalls. This process is has not been completed as of this date.