Manistique River and Harbor Site
You will need the free Adobe Reader to view the files on this page. See EPA's PDF page to learn more.
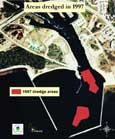
Figure 1
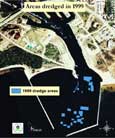
Figure 2
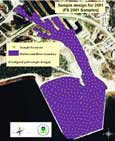
Figure 3
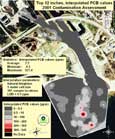
Figure 4
Background
The Manistique Harbor and River Superfund site is located in Manistique, Michigan on the southern shore of Michigan’s Upper Peninsula. The River and Harbor discharge into the Lake Michigan. The contaminant of concern is PCB (polychlorinated biphenyl). The U.S. EPA and the FIELDS Team have been active at the site since 1995. The FIELDS Team has performed sample designs, bathymetric surveys, and PCB contamination analyses.
Dredging
Removal of PCB-contaminated sediment and on-site treatment began in 1995. Dredging events continued through 2000 (see Figures 1 and 2).
- Figure 1 (poster 13.57 x 16.36 inches, 1.69MB, About PDF) shows the areas dredged in 1997. These areas are shown as dark orange.
- Figure 2 (poster 13.57 x 16.36 inches, 1.72MB, About PDF), on the right, shows those areas dredged in 1999. The areas dredged are shown as blue. It is estimated that 10,603 pounds of PCBs were removed from the River in Harbor between 1995 and 2000.
PCB Concentrations
In order to determine the extent and concentrations of PCBs, the FIELDS Team developed sample designs for the Manistique River and Harbor. The most recent sample design, for the summer of 2001, was an unaligned grid design of 400 sample locations. The unaligned grid design ensures that the areas of interest, the River and Harbor, are adequately sampled and will provide data that are statistically valid. The design is shown in Figure 3 (poster 10.85 x 13.28 inches, 1.14MB, About PDF). The gold dots are the sample locations. The purple polygon is the area sampled.
In the summer of 2001, the site underwent a final extent of contamination assessment to determine PCB values that remained. The goal of a site-wide average concentration of PCBs less than or equal to 10 parts per million (ppm) throughout the sediment column in the Manistique Harbor and River was achieved. The average concentration of PCBs was 7.06 ppm. The 95% confidence interval for this value ranges from 4.40 to 9.72 ppm. In other words, there is a 95% confidence that the mean PCB value in Manistique Harbor and River is between 4.40 and 9.72 ppm.
A map of the interpolated values (estimates of PCB based on the original data) is shown in Figure 4 (poster 10.85 x 13.13 inches, 1.08MB, About PDF). The map shows the interpolated PCB values in the top 1 foot (0-12 inches) of sediment in the River and Harbor. The legend identifies areas of specified concentration intervals.