Containment of Wastes Under the Land Ban Program
This document has been prepared to give you basic information about how the land ban program works. It is divided into the following sections:- Introduction
- Geological Features Affecting No Migration Demonstrations
- Pressure Increase in the Injection Zone
- No Migration Demonstration
- Movement of Waste
- Conservatism of Assumptions
- For More Information
Introduction to the Land Ban Program
The land disposal restrictions were enacted through the Hazardous and Solid Waste Amendments of 1984 which amended the Resource Conservation and Recovery Act to add significant new restrictions on the disposal of hazardous waste. Under the amendments, land disposal of hazardous wastes is prohibited unless
- the waste has been treated to become nonhazardous or
- the disposer can demonstrate that the waste will remain within a defined area for a period of 10,000 years, using computer simulations based on actual measurements of conditions at the site. (This is the demonstration of no migration.)
Restrictions on specific hazardous wastes were phased in over time: for some wastes they became effective as early as August 8, 1988; other hazardous wastes are still being added to the list. The area within which the waste will be confined must not include any underground sources of drinking water.
When an applicant within U.S. EPA's Region 5 (comprising the states of Illinois, Indiana, Michigan, Minnesota, Ohio and Wisconsin, with offices in Chicago) petitions the U.S. EPA for an exemption from the restrictions on the land disposal of hazardous wastes, the Underground Injection Control (UIC) Branch reviews all the available information to determine if the demonstration meets the requirements of the regulations.
In places where there are thousands of feet of sedimentary rock between the injection zone and the deepest underground source of drinking water, it is usually possible for petitioners to make this demonstration successfully, but properly documenting and supporting the demonstration are very complex. Therefore, the petition review process frequently takes more than a year to complete and the UIC Branch often sends formal requests for changes and additional information to the applicant. At this time, there are 26 Class I hazardous injection wells in Region 5. (More information about injection wells in Region 5, a list of Class I wells in Region 5 and a map of Class I sites regulated by U.S. EPA Region 5 is available.)
Geological Factors Affecting No Migration Demonstrations
|
Although many people express doubt about these demonstrations, in the case of
deep injection wells, such a demonstration can be credible. In fact the
demonstration is usually not a difficult task if the area in which the well
is to be drilled has two features:
|
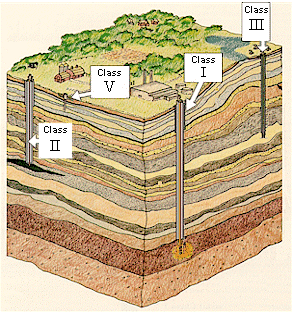 |
| The demonstration is possible because rocks in the deep subsurface in environments such as those described above were deposited over a very long period during which the conditions changed many times. During each period a broad layer of rock was formed. Some rocks are very tight and allow fluid movement only very slowly, effectively being impermeable. Other layers allow movement much more easily. The rock layers have been buried as the basins in which they were deposited have intermittently sunk deeper. The rocks in the center of the Michigan basin, for instance, were deposited in relatively shallow water (less than several hundred feet deep), but the deepest are now more than 13,000 feet below the surface. All of the very small pore spaces within rocks are filled with some sort of fluid. It may be oil or a gas, but usually the fluid is water, and normally, once the rocks are buried deeply enough to prevent rain water from seeping in, the water is much saltier than sea water. This water moves very slowly, less than one foot per year, if at all. | 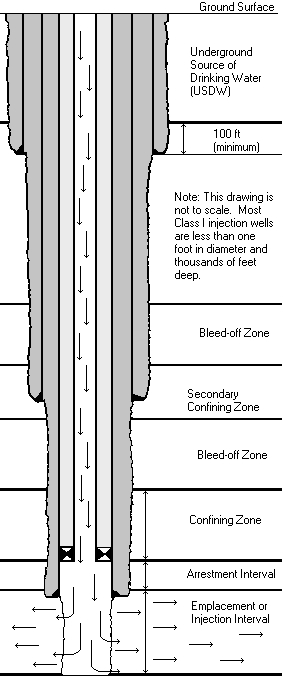 |
Pressure Increase in the Injection Zone
When liquid wastes are injected, there is a pressure increase near the injection well during the period of injection. Most of this pressure decreases very quickly as the liquid which is forced into the porous rock formation spreads away from the injection wells, although it takes a period several times longer than the period of injection for the pressure to dissipate completely. This pressure due to injection is the force which is most likely to cause contamination of drinkable water: if there are paths by which the waste can move upward into underground sources of drinking water, this pressure will cause that movement to occur. However, because the waste must pass through many layers of rock, there is little chance that the amount of vertical movement will be sufficient to allow contaminants to reach underground sources of drinking water. This is true for the following reasons.
- When pressure increases, there is a tendency for fluid to move both horizontally and vertically.
- Because the rocks are in horizontal layers, movement in porous, permeable rocks progresses much farther horizontally than vertically.
- When movement through a layer having low permeability occurs, the pressure is released horizontally again so that the pressure which is left to drive fluids upward through the overlying, less permeable rock is much less than the pressure which caused movement through the previous, lower layer of impermeable rock.
The best analogy to this effect is electrical flow through resistors connected in series and in parallel. If an electric current must flow through one resistor after another, each one opposes the flow and the flow will be low, less than it would be if the current had to go through the most resistive resistor. If the same resistors are connected in parallel, so that the current has a choice of any of the resistors to flow through, the total resistance in the system will be less that of the least resistive resistor.
In the case of fluid flow in rocks, this means that horizontal flow (in the direction of the layering) is much more likely than vertical flow (across the layering). These more permeable layers are sometimes referred to as "bleed-off zones" because they allow the pressure to bleed off, that is, spread out to the point that the excess pressure is reduced to zero.
This typical arrangement of sedimentary layers is so effective that it will prevent movement across more than a few layers which are significantly less permeable than others. As a result, the only way movement is likely to occur when waste is injected deep in sedimentary rocks is if
- there is little vertical variation (such as occurs in the porous carbonate sections of Florida),
- there are deep wells that are unplugged or plugged improperly, or
- there are open fractures in the rock layers, such as might be associated with mountain building.
Most applicants for exemptions to the land ban hire a consulting firm with expertise in this subject to prepare the demonstration. The demonstrations must show that
- the rocks are such that they will restrict vertical movement,
- there are no known open fractures and
- there are no deep wells within the area which might be affected by the injection operations.
The computer models which simulate the effects of underground injection use equations which describe the physical processes which take place in the injection zone. In order to do this accurately, the computer models require certain information describing both the injection zone itself (such as thickness and permeability) and the injection process (such as injection rate and length of time fluid will be injected). In order to be conservative, these models use parameters which decrease the chances of success of the demonstration to represent variability in local geological conditions. (This is sometimes described as a "worst-case scenario".) As a result, the volume of rock which the computer simulation indicates will ultimately contain the injected wastes is much larger than the actual volume will be.
|
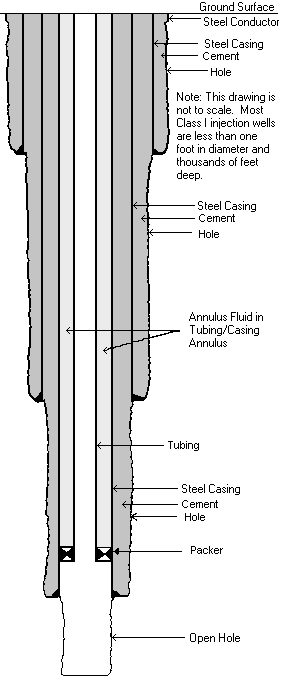
In addition, the applicant must also demonstrate that the wells themselves
are constructed in a way that allows the well to be monitored to be
sure that no fluid can leak through the casing or up around the casings
which are cemented into the well bore. (This is called
mechanical integrity.)
This is done by testing the well to demonstrate that there are no leaks
in the casing or the tubing within the casing through which the waste
will actually be injected. (This is called a
mechanical integrity test.)
In another test, radioactive iodine 131 is released deep into the well. (Iodine 131 has a short half-life, eight days.) A tool which can detect the radioactive iodine is lowered into the well on a cable and traces the movement of the iodine 131 while the iodine is in the well or within about a foot of the well bore. This test shows whether there is any upward movement around the casing. These tests are repeated annually. At five-year intervals, a nearly continuous series of measurements of temperatures along the well bore is made and a plot of the temperatures is produced. If waste or other liquids are moving along the well bore, the temperature measurements will detect it because the well bore will be cooled or warmed by the fluid outside. This is a very sensitive test.
|
|
The computer simulation models consider a variety of different factors affecting the movement of the waste, such as
- the movement due to the injection itself
- the movement due to natural flow within the deep aquifer (generally very slow, called regional drift),
- the movement due to density differences between the injected waste and the natural brine in the formation (buoyancy) and
- the movement due to diffusion
In many cases, the vertical movement due to pressure is less than ten feet.
Diffusion includes the movement of individual molecules during the 10,000 year period after the wells are plugged. In most cases, at a distance less than 250 feet above the limit of upward movement due to pressure, the concentration of the most mobile molecule of waste, hazardous or not, will be one trillionth of its original concentration. Even if the waste is 100% of some hazardous liquid, the concentration would be only one in a trillion at this point. In fact, most of the waste injected is water. However, there are a few substances which are hazardous at even one part per trillion. Limits on the concentration of these wastes can be set in the permit to ensure that the conditions under which the petition is granted are maintained and are enforceable. Because the top of the injection zone is usually several thousand feet below the surface and the distance even a trillionth of the waste might be found is less than 250 feet higher, we can be reasonably certain that vertical movement into an underground source of drinking water will never occur.
We can describe horizontal movement of waste using simple geometry. For example, if a facility injects waste at a rate of 100 gallons per minute continuously for a year, the volume of waste injected in one year will be:
100 gal/min x 60 min/hr x 24 hr/day x 365 day/yr = 52,560,000 gal/yr
Since one gallon occupies 0.13368 cubic feet, this represents 52,560,000 x 0.13368 cubic feet/gal = 7,026,221 cubic feet of waste per year.
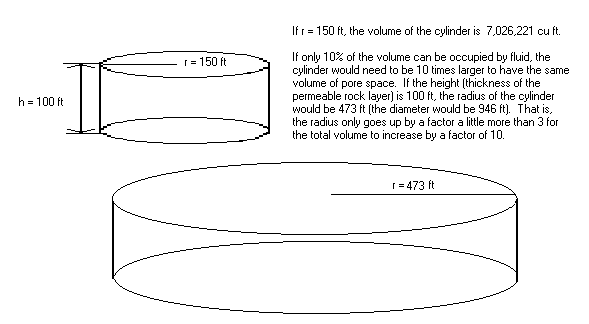
For purposes of illustration, imagine the waste moving away from the well bore as a cylinder of fluid, sometimes called a "plume". If the effective thickness of the injection zone is 100 feet, this will be the height of the cylinder. We can use the equation for the volume of a cylinder (volume = height x 3.14 x radius2) to calculate the radius this cylinder would have based on the amount of waste that has been injected. For one year's waste, the radius can be calculated to be 150 feet, that is, the diameter of the cylinder with a volume of 7,026,221 cubic feet and 100 feet high would be 300 feet. However the fluid cannot occupy the entire volume of the cylinder, since the cylinder into which the fluid is being injected is composed of solid (but porous) rock. The fluid can only occupy the pore spaces within the rock. If the rock has a porosity of 10%, the volume of rock that will be filled is actually 10 times the value calculated above, that is, 70,262,210 cubic feet. This cylinder would have a diameter of 946 feet. At the end of five years, the diameter of the cylindrical waste plume would be 2115 feet. At the end of ten years, the diameter of the waste plume would be 2991 ft.
Because the plume does not move so regularly and maintain a perfectly cylindrical form, the effects of dispersion are calculated in the computer model. This requires the value of certain parameters which describe dispersion in porous rocks. Because we cannot know the exact values of these parameters for the rocks at this site, the values used in the model are based on a number of studies. (Even if it were measured in the well bore of this well, the value varies from place to place within the rock.) Including the effects of dispersion increases the radius of the cylindrical plume by several hundred percent. After injection ceases and the well is plugged, the plume will continue to move throughout the 10,000-year period as a result of
- the natural movement of water (regional drift) estimated at about six inches per year within the Mt. Simon Sandstone and
- density differences.
That is, if the injected fluid is lighter than the salty water already in the Mt. Simon Sandstone, it will tend to rise. If it is more dense, it will tend to sink.
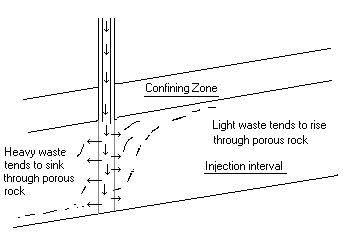
For example, in Michigan, because the top and bottom of the injection interval are almost impermeable, the plume will move either downward toward the center of the basin or upward toward the divide separating the Michigan Basin from the rocks surrounding the basin. (The rocks within the Lower Peninsula dip slightly toward a point in north-central Michigan so that rock formations which are near the surface in the Detroit area are thousands of feet deep in the area around Mt. Pleasant.)
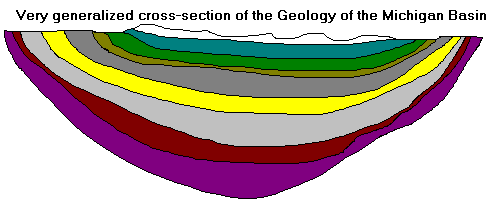
The amount of this movement can also be calculated. To be very conservative, consultants assume first that the entire injected volume will be very heavy (for example, has a specific gravity of 1.26, significantly heavier than the specific gravity of the natural brine in the Mt. Simon Sandstone). Using that value the plume would drift downward at most 18,000 feet (measured as a horizontal distance from the well) into the deeper part of the Michigan Basin. To be sure that this is the farthest extent of movement, the permit can limit the density of the waste to the value used in the computer modeling.
In the case of injection of a light waste, equivalent to the specific gravity of wood alcohol at 0.88, for example, the movement would be upward a comparable distance. Ignoring the effects of a factor which would reduce the distance of movement is just one conservative assumption among many. The distance of movement due to buoyancy is highly dependent on the contrast in densities. If more realistic values are used instead of the extreme values used in this example (the wells will inject neither 100% heavy nor 100% light waste) or if the mixing of the injected fluid with formation fluid is accounted for, then the distances are greatly reduced.
It is very likely that the actual distances from the well bore to the edge of the plume, where its concentration has been reduced to one trillionth of the original concentration, will be as little as a third of the distances cited above. All in all, the estimates prepared by consultants show movement reaching far beyond the point where more realistic, less conservative assumptions predict movement over a period of 10,000 years. This overestimation is done to be sure that a search for abandoned wells will be made over a significantly larger area than the waste will reach. Abandoned wells which remain unplugged or improperly plugged are the most likely conduit which might allow wastes injected through the wells to reach underground sources of drinking water. As a result, we have tried to be as sensitive to their existence as possible. Applicants for land ban exemptions are required to provide detailed information about all wells located within the area calculated by the computer simulations described above. Documentation about each well is examined in detail.
We hope that you have a general understanding of the types of investigations which are made to ensure that any waste injected will never pose environmental problems. We believe that if operators can make the required demonstrations, we can rely on these results to overstate the movement of injected wastes. The final version of a land ban demonstration cannot be made until the wells are drilled, so that the best values of the site-specific parameters discussed above (such as porosity and permeability of the injection zone) are used in the computer models. If no information can be found to refute the demonstration that the waste will not migrate out of the injection zone within 10,000 years, we believe that the land ban demonstration will guarantee the safety of the underground injection operations.
If you have questions about this material, please contact:
Dr. Steve Roy, Geologist
roy.stephen@epa.gov
312-886-6556
Underground Injection Control Topics | Other Local Water Topics
![[logo] US EPA](../gif/logo_epaseal.gif)