Preliminary Findings of the Ecological Committee on FIFRA Risk Assessment Methods (ECOFRAM) : V. Aquatic Exposure Assessment
Paul Hendley (Zeneca Ag Products), James Baker (Iowa State Univ.), Lawrence Burns (EPA-ORD Athens), David Farrar (EPA OPP), Alan Hosmer (Novartis), David Jones (EPA OPP), Walton Low (USGS)
On this Page
- Abstract
- Tier 1 - Screening Exposure Estimates
- Tiering Concept Example
- Tiered Process Goal
- Tier 2 - Exposure Characterization
- Tier 3 - Tools to Refine Exposure
- Tier 4 - Major Conditional Monitoring or Mitigation Studies
- Example ECOFRAM Products
Abstract
The Aquatic Exposure Subgroup has explored a variety of tools and approaches for clarifying uncertainty and incorporating probabilistic approaches into the assessment of aquatic exposure to pesticides. Reviews of the current risk assessment models and process have generated listings of factors for consideration. Reviews of sources of data and suggestions for enhancing the FIFRA Part 158 requirements for generating, calculating, reporting and expressing data important for modeling aquatic exposure are available. A logical tiered risk assessment process has been agreed with the aquatic effects workgroup (see Poster VII) and exposure related steps have been defined. Where possible, existing exposure models are suggested but, where necessary, improvements have been suggested. A practical tool (RADAR) has been developed to analyze EXAMS output to estimate the frequency and duration of peaks above a user specified threshold from a multiple year output sequence and estimating recovery intervals between high concentration "events". Recommendations are under development to further enhance aquatic exposure modeling and implement ECOFRAM concepts . Appropriate tools have been designed or defined.
Tier 1 - Screening Exposure Estimates
Purpose
Tier 1, the screening tier, aims to
- Prioritize the use patterns for a product in terms of potential environmental exposures
- Provide an assessment of whether acute or chronic concentrations may be of concern
- Identify those products which have minimal environmental/ecological concerns
- Focus future work on combinations of use patterns and taxa most likely to be of concern
Decisions
A simple (deterministic) risk quotient leads to one of two actions.
- Conservatively estimated concentrations for use pattern "X" indicate that in static and/or surface waters, no ecological hazard above the level of concern is likely to result from use of the product to taxa A, B or C.
- The predicted conservative exposure value when compared with a standard battery of toxicity test results suggests that the possibility of an adverse impact to taxa A, B or C exists. It is therefore necessary to progress to Tier 2 to refine the exposure estimate.
Desirable Characteristics
Characteristic Now? User friendly shell x "Conservative" assessment of SW Concentrations √ Reflect runoff, erosion, and drift √ National assessment Uses simple version or meta-model of models used in higher tiers √ Scenarios cover necessary crops x Scenarios cover flowing & static water x Scenarios ranked in "severity" context x Scenarios can be matched to 90%ile of Tier 2 x Outputs to include - Water Column instantaneous concentration
- Water Column concentrations at various intervals (24h, 48h, 96h, 21d, 60d, 90d)
- Error estimates
- Sediment concn. /sediment pore water concn.
- Indicator of "shape" of the exposure
√
√
x
x
xProvides simple deterministic quotient √ Covers simple mitigation (rate change) √
Tiering Concept Example
Diagram A
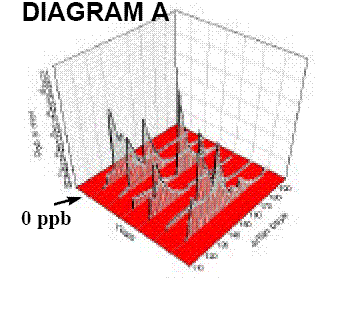
The concept of a tiered approach to estimating aquatic exposure can be likened to drawing a rubber sheet down progressively over the "true exposure surface". For example, Diagram A shows the residue exposure profile in a river system estimated using PRZM/EXAMS for Julian Days 100 to 200 across 6 years (a full model run would typically be 365 days by 36 years).
Diagram B
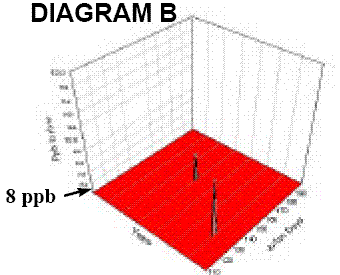
A Tier 1 prediction is required to be conservative and exceed predictions for the vast majority of anticipated events - Diagram B shows what happens when such a highly conservative assumption is made - the default assumption (8 ppb) applies to all cases with only the most extreme events exceeding the Tier 1 prediction. The "sheet" reveals those most extreme events but masks the rest; almost no information is available to characterize magnitude, duration or frequency of events.
Diagram C
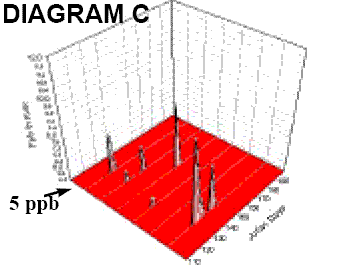
Diagram D
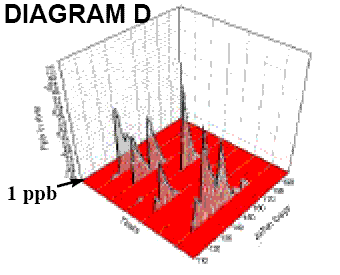
Diagrams C & D show that with progressively more sophisticated examination of the exposure (i.e. Tier 2 and then 3/4) , the assessment more closely reflects reality and more detail on the exposure events becomes available. The "rubber sheet" conforms closely with more of the true exposure surface. A similar paradigm could apply to understanding regional or local spatial variation.
Tiered Process Goal
ECOFRAM's aquatic exposure estimation tiers aim to improve understanding of:
- the probability distribution of exposures of a given magnitude
- the distribution of spatial variation of potential exposures in terms of
- variation within a water body,
- between water body types,
- within a watershed and by region
- the distribution of temporal variation of exposures in terms of
- duration and frequency above a certain magnitude
- intervals between "events"
- seasonal differences
- the potential for exposure to be mitigated by various measures
Diagram E
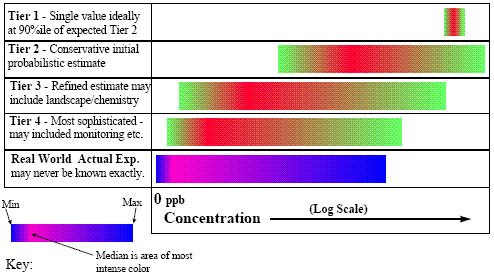
Diagram E depicts the conceptual relationship of the tiers in terms of the distributions of values. Tier 1 is a single value at 90% of the Tier 2 prediction and Tiers 3/4 progress Tier 2 modeling towards reality by considering unexposed scenarios etc. Ultimately, where needed, Tier 4's monitoring efforts can truly tie models to actual data.
Tier 2 - Exposure Characterization
Mark Russell (Dupont Ag Products), Mari Stavanja (Florida Bureau of Pesticides), Martin Williams (Waterborne Env. Inc.) and James Wolf (EPA OPP)
Purpose
The intent of Tier 2 is to
- Characterize spatial-temporal variations of exposure in headwater ecosystems
- Produce monthly, seasonal, and annual frequency distributions
- Provide a regional ranking of exposure
- Prioritize environmental settings and/or use patterns in terms of potential exposure
- Identify use patterns that have minimal environmental/ecological concerns
- Focus future work on specific scenarios of concern.
- Address impact of some typical mitigation alternatives
Decisions
The distribution of exposure concentrations in SW adjacent to treated fields for appropriate product use patterns generated at Tier 2 permits three outcomes
- Risks are determined to be minimal and the registration process may continue
- Label modifications (i.e. mitigation steps) are required to ensure that concentrations predicted to be of concern would not occur
- Exposure assessment needs to be refined to prove that concentrations predicted to be of concern are unlikely to occur in practice
Desirable Characteristics
Characteristic Now Automated process, user input controlled ?? Regional or national assessments x Accounts for application factors - rates, methods and frequencies
√
??Accounts for key chemical variables ?? Can be run for two sets of properties - "conservative" parameters
- "best estimate" parameters
??
√
√Uses standardized scenarios for uniformity - represent real uses, soils, fate factors
- address federal & state needs.
- region grouping to reflect key variables
- basin:water body area ratios;
- water body parameters
- two headwater systems, lentic / lotic
√
x
x
??
x
x
xUses local weather across >35 years √ Incorporates all key fate processes x Accounts for many mitigation options x
Desired Outputs
Desired Outputs Now Full GMP information x Tables and graphs √ Probability analyses - ann./30d extreme series
- peak concns.
- pre-set intervals
- user-defined interval
√
√
√
√
√Event definition - "event" above threshold
- annual OR seasonal
- "event" characterization
- duration & "shape"
- peak & mean concn.
- integral > threshold
- "Recovery" period
??
??
??
??
??
??
??
??Flexible event summaries - Nos. events > threshold duration/recovery limit
??
??- ann./30d extreme series
Tier 3 - Tools to Refine Exposure
Purpose
Tier 3 refines Tier 2 exposure distribution predictions. The toolbox includes
- Refining Tier 2 modeling
- Use secondary models that better represent system(s)
- Use customized aquatic scenarios to address other waterbodies
- Use customized scenarios to address temporal and spatial issues
- Use probabilistic analysis techniques e.g. Monte-Carlo techniques
- Examine impact of mitigation alternatives in detail
- Generate additional environmental fate (lab/field) data
- Investigate actual landscape configuration for model scenarios e.g.
- distance from application areas to water bodies
- field size to water body size ratios
- position of vegetative filter strips
- Conduct fate & transport studies to better represent processes e.g.
- fate-o-cosms
- small-scale runoff studies
Decisions
Exactly as Tier 2.
Tier 4 - Major Conditional Monitoring or Mitigation Studies
Purpose
Tier 4 encompasses a further toolbox of approaches selected as needed to reduce uncertainty, incorporate additional variability or better represent reality. Will focus on settings shown in Tier 3 to have significant risk. Approaches include
- Strategically designed large scale monitoring studies to confirm model predictions
- Refined watershed models for Basins/larger receiving waters.
- "Benchmark" modeling to compare product with similar chemicals included in major monitoring programs (e.g. NAWQA) to "validate" model
- Fullest evaluations of mitigation measure impacts
- Exhaustive analyses of landscape & resulting site specific modeling
Cost implications of these options are considerable so agreement is needed between EPA and Registrant under a conditional registration before Tier 4 can commence.
Decisions
Exactly as Tier 2.
Example ECOFRAM Products
Idealized Expression of Exposure
Essential to express exposure assessments in highly specific terms to ensure clear communication with risk managers and aquatic toxicologists, e.g.
"33% (+/- 10%) of growing seasons experience events that exceed the 48 h Daphnia LC50 for at least 48 h without a subsequent recovery period of at least 21 days for pond in the MW adjacent to corn fields treated with one application of X at 1 lb./acre/season. It is believed that events below this level are unlikely to be of significant concern"
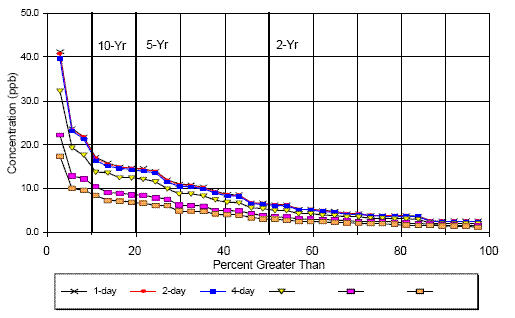
RADAR - Risk Assessment tool to evaluate Duration And Recovery.
RADAR has been developed to meet Tier 2 output goals (above) and process data from existing output from PRZM-EXAMS or MUSCRAT models. Examples are shown below. The table shows a summary of model output data for a stream, these results could be further evaluated to determine how many events met some user defined combination of concentration, duration & recovery period. The graph shows the annual maximum series for standard intervals matching toxicity studies.
| Threshold Concn. | No. of events | % time over threshold | Peak Concn. | Avg. Concn. | Duration (days) | Inter-event Interval | ||||||||
|---|---|---|---|---|---|---|---|---|---|---|---|---|---|---|
| Min | Max | Avg | Min | Max | Avg | Min | Max | Avg | Min | Max | Avg | |||
| 35 | 63 | 0.6 | 36.3 | 174 | 83.3 | 36.3 | 160 | 79.3 | 1 | 3 | 1 | 1 | 389 | 205 |
| 70 | 35 | 0.3 | 70.6 | 174 | 109 | 70.6 | 160 | 106 | 1 | 2 | 1 | 1 | 1099 | 371 |
| 104 | 17 | 0.15 | 106 | 174 | 136 | 106 | 160 | 131 | 1 | 2 | 1 | 243 | 2185 | 765 |
| 139 | 5 | 0.05 | 149 | 174 | 160 | 14 | 160 | 156 | 1 | 2 | 1 | 364 | 3285 | 2020 |
| 174 | 1 | 0.01 | 174 | 174 | 174 | 174 | 174 | 174 | 1 | 1 | 1 | 9740 | 9740 | 9740 |
Annual Maximum Series