A PROGRESS REPORT FOR AQUATIC EXPOSURE ASSESSMENT IN THE U.S. EPA OFFICE OF PESTICIDE PROGRAMS
James Lin. OPP/EFED, US EPA, Washington, DC.
On this Page
- Introduction
- Poster Outline
- Level 2 Modeling Approach
- Schematic of Level 2 Models
- PRZM - Pesticide Root Zone Model
- EXAMS - Exposure Analysis Modeling System
- AgDRIFT - Spray Drift Model
- Development of Modeling Scenarios
- Major Land Resources Areas and Associated Meteorological Stations
- Some of the Modeling Scenarios
- Test Chemical - ChemX
- Iowa Corn Scenario
- PRZM - EXAMS Results
- Sensitivity Analysis of PRZM
- Critical Inputs: Runoff
- MUSCRAT (Multiple Scenario Risk Assessment Tool)
Introduction
As a continued effort to reduce the uncertainties in aquatic exposure assessment, Environmental Fate and Effects Division (EFED) in the Office of Pesticide Programs (OPP) has begun a new initiative to move to a tiered approach to ecological risk assessments. The approach developed includes probabilistic tools and methods for use in the pesticide regulatory process, which would address the magnitude and probability of risk and provide an estimate of the associated uncertainty. The approach proceeds through four levels of analysis or refinement, from simple deterministic quotients through a general probabilistic analysis, to an issue-specific probabilistic assessment in the highest levels. This presentation provides an update on an approach recently taken for the aquatic exposure assessment of an example chemical. Specifically, a sensitivity analysis of PRZM (Pesticide Root Zone Model) input parameters was conducted. The most sensitive parameters were investigated for the impacts on runoff/erosion predictions. The variability associated with the different regions to impact the estimated environmental concentrations was also discussed.
Poster Outline
Describe the current level 2 modeling approach for aquatic exposure assessment.
Present the sensitivity results of PRZM model inputs for runoff predictions.
Outline the on-going approach to address the variability associated with different regions.
Level 2 Modeling Approach
To characterize temporal variations based on the historical weather pattern for a specific area.
To provide the model estimates of pesticide loadings to the standard pond and the resulting EECs from one reasonable worst case scenario over multiple years.
Runoff/erosion estimations with PRZM
Surface water concentration estimations with EXAMS
Schematic of Level 2 Models
Schematic of Level 2 Models
PRZM - Pesticide Root Zone Model
PRZM - Pesticide Root Zone Model
Field scale - homogeneous soil, crop, and land use
To simulate chemical movement in the unsaturated soil system within and below plant root zone
Hydrology components:
Runoff (SCS curve number approach)
Erosion (modified soil loss equation, MUSLE)
Evapotranspiration (pan data or air temperature)
Percolation (water routing technique)
Chemical transport components:
Plant Uptake, Foliar Wash-off and Decay,
Surface Runoff and Erosion, Decay, Volatilization,
Advection and Diffusion, Adsorption (Retardation)
EXAMS - Exposure Analysis Modeling System
EXAMS - Exposure Analysis Modeling System
Chemical Fate Processes:
Ionic and Sorptive Equilibria
Advective and Dispersive Transport
Transformation Processes:
Volatilization, Hydrolysis, Photochemical Reactions,
Redox Reactions, and Microbial Biotransformation.
To provide analyses of chemicals (and their degradates) in the aquatic systems -
fate: spatial distributions of the chemicals;
persistence: the persistence of the chemicals;
exposure: EECs @ 0, 4, 21, 60, and 90-day
AgDRIFT Spray Drift Model
The modeling product of the cooperative research agreement between EPA, USDA, and SDTF (Spray Drift Task Force)
AgDRIFT estimates downwind deposition from liquid spray applications
AgDRIFT is three models rolled into one:
Aerial: A mechanistic model (derived from FSCBG) which has been validated against field data.
Ground Boom: Empirically developed deposition curves based on on 4 application categories. Future improvements to include tolerance bounds.
Orchard Airblast: Empirically developed deposition curves based on eight kinds of orchards and orchard groupings. Future improvements to include tolerance bounds
Development of Modeling Scenarios
Select location with high expected rainfall within crop growing areas
Select soil with high expected runoff and soil erosion
Utilize actual measured weather data from U.S. National Weather Service
Use multiple years (36) of weather for temporal probabilistic assessment at the site
Major Land Resources Areas and Associated Meteorological Stations
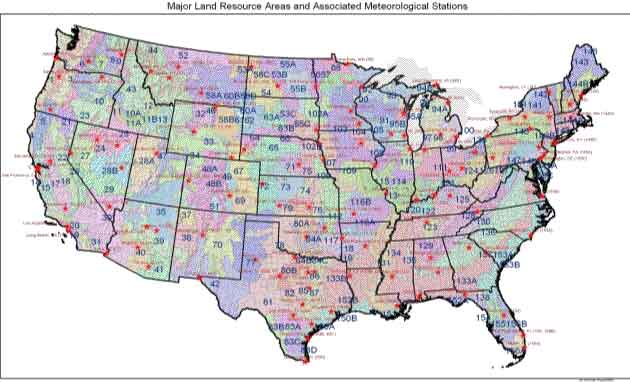
Major Land Resources Areas and Associated Meteorological Stations
Some of the Modeling Scenarios
| STATE | CROP | MLRA1 | SOIL |
|---|---|---|---|
| CA | Alfalfa | 17/18 | Sacramento |
| CA | Citrus | 17 | Exeter |
| CA | Corn | 18 | Madera |
| CA | Cotton | 17 | Twisselman |
| CA | Fruit (non-citrus) | 17/18 | Exeter |
| CA | Grape | 17/18 | San Joaquin |
| CA | Sugarbeet | 17/18 | Exeter |
| CA | Tomatoes | 17/18 | Stockton |
| CA | Walnuts / Almonds | 17/18 | Mateca |
| FL | Cabbage | 156B | Riviera |
| FL | Citrus | 156A | Wabasso |
| FL | Cucumber | 156B | Riviera |
| FL | Sugarcane | 156A | Wabasso |
| FL | Sweet Corn | 156B | Riviera |
| FL | Turf | 156A | Adamsville |
| IL | Corn | 108 | Adair |
| LA | Sugarcane | 131 | Commerce |
| MN | Alfalfa | 56 | Bearden |
| MN | Sugarbeet | 56 | Adair |
| MS | Corn | 134 | Grenada |
| MS | Cotton | 131 | Loring |
| MS | Soybean | 134 | Loring |
| NC | Alfalfa | 130 | Helena |
| NC | Apple | 130 | Hayesville |
| NC | Corn - E | 133A | Craven |
| NC | Corn - W | 130 | Chewacla |
| NC | Cotton | 133A | Boswell |
| NC | Peanut | 130 | Craven |
| NC | Tobacco | 133A | Norfolk |
| ND | Corn | 56 | Bearden |
| ND | Wheat | 56 | Bearden |
| OR | Apple | 2 | Cornelius |
| OR | Berries | 2 | Woodburn |
| OR | Christmas Trees | 2 | Pilchuck |
| OR | Filberts | 2 | Cornelius |
| OR | Grass Seed | 2 | Dayton |
| OR | Hops | 2 | Woodburn |
| OR | Mint | 2 | Newberg |
| OR | Sweetcorn | 2 | Woodburn |
| OR | Vegetable (non-tuber) / Snapbeans | 2 | Dayton |
| OR | Wheat | 2 | Bashaw |
| PA | Alfalfa | 148 | Glenville |
| PA | Apple | 148 | Elioak |
| PA | Corn | 148 | Hagerstown |
| PA | Turf | 148 | Gkenville |
| PA | Vegetable / tomatoes | 148 | Glenville |
| TX | Alfalfa | 87 | Lufkin |
| TX | Corn | 87 | Axtell |
| TX | Cotton | 86 | Crockett |
| TX | Sorghum | 87 | Axtell |
| TX | Wheat | 86 | Crockett |
Test Chemical - ChemX
Use: Corn, 2 aerial spray @ 1.0 lb a.i./ac on May 5 and 20
| Parameter | Value |
|---|---|
| MWT (molecular weight) | - 200 g/mole |
| VAPR (vapor pressure) | - 5.0 x 10⁻⁷ torr (mm Hg) |
| HENRY (Henry's Law const.) | - 2.0 x 10⁻¹⁰ atm.m3/mole |
| KOC | - 10 to 100 (ml/g) |
| SOL (Water Solubility) | - 700 mg/L |
| Parameter | Value |
|---|---|
| Kd | KPS (0.1 to 2.0 ml/g) |
| Hydrolysis T1/2 | KAH (300 days @ pH 6.2) KNH (30 days @ pH 7) KBH (1 day @ pH 9.1) |
| Soil Aerobic T1/2 | 200 days and 350 days |
| Aquatic Aerobic T1/2 | KBACW |
| Aquatic Anaerobic T1/2 | KBACS |
| Aquatic Photolysis T1/2 | KDP (6 days) |
Iowa Corn Scenario
A corn field in Pottawottamie County, Iowa, within the Major Land Resource Area (MLRA) 107 - Iowa and Missouri Deep Loess Hills.
The soil is Marshall silty clay loam soil, which belongs to "B" hydrological soil group.
The weather data were taken from weather station W14943 in Sioux City, Iowa.
PRZM - EXAMS Results
Models Report Maximum Annual Peak Concentration Values & Maximum Average 4 Day, 21 Day, 60 Day, and 90 Day
Concentration Values Are Sorted and Ranked and 1-In-10 Year Return Period Values are Calculated For Use in Risk Assessment
EEC Plot - ChemX Use on Corn
Sensitivity Analysis of PRZM
Investigate the output sensitivity to variation in input parameters for PRZM3 using Plackett-Burman analysis for six field runoff data sets. (Carbone, et al. 2001, SETAC-US)
Runoff Flux
Critical Inputs: Runoff
Curve number 2 (cropping season) (CN2).
Curve number 1 (fallow field) (CN1).
Adsorption/Desorption coefficient (layer 1).
Decay rate (layer 1).
Bulk density (available water holding capacity) (BD).
Foliar decay rate.
Management factor II (cropping season).
Application rate.
Inputs Worksheet
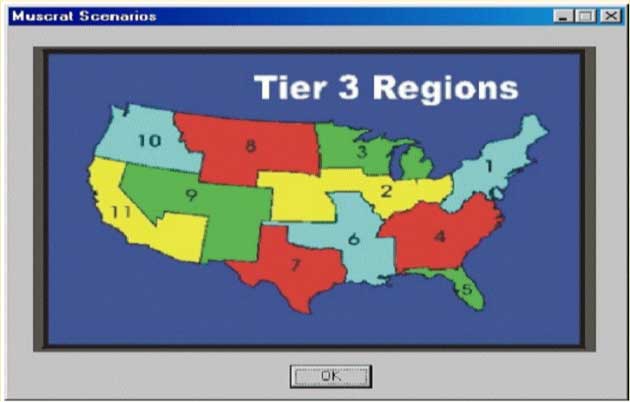
MUSCRAT (Multiple Scenario Risk Assessment Tool
Depending on the crop, MUSCRAT will examine the daily movement of the pesticide for at least 36 years, in up to 25 specific soil/weather combinations, in up to 11 regions of the United States.
MUSCRAT links users input information on the chemical with automatically selected soil, and climate data bases, based on the crop to which the pesticide is being applied to develop PRZM input files.
The fate of the pesticide that moves from treated fields into water bodies is then evaluated using the EXAMS model to calculate the potential exposure of aquatic organisms to the pesticide.
Muscrat Scenarios