Office of Pesticide Programs Level 2
Refined Acute Lethal Risk Assessment Model for Birds
E.C. Fite, E.W. Odenkirchen, T.M. Barry, D.F. Young, T.A. Bargar, J.D. Felkel, F. Mastrota, G.T. Patrick, D.B. Farrar
On this Page
- Introduction
- SAP Recommendations to the Agency
- Updated Model Features
- Typified Bird Species
- Bimodal Feeding Pattern
- Behavioral Fidelity
- Field-Scale Puddle Model
- Interception of Runoff
- Puddle Hydrology/Pesticide Concentration
- Modeling the Inhalation Route
- Inhalation of Directly Applied Spray
- Calculating Air Concentration
- Modeling the Dermal Route
- Directly Applied Spray Dermal Exposure
- Dermal Contact with Foliar Residues
- Example Model Outputs
Introduction
The U.S. Environmental Protection Agency, Office of Pesticide Programs continues to develop a model to estimate the magnitude and probability of acute effects to non-target avian species from pesticides. This effort is part of the initiative to revise the Agency's ecological assessments for pesticides.
As part of the continued improvement process the Agency consulted with the EPA Science Advisory Panel on elements of a pilot risk assessment model that utilised Monte Carlo sampling techniques to evaluate probability and magnitude of acute lethal response of selected bird species to dietary and drinking water exposures of chemical residues in a pesticide treated agroenvironment.
SAP Recommendations to the Agency
Among the recommendations made by the SAP concerning improvement of the pilot model were:
Early Level of Refinement use of generic bird types
Consideration of more realistic feeding patterns
Multi-compartment modeling of surface drinking water sources
Consideration of additional routes of exposure
Model exposure time-steps shorter than pilot model's 12-hour increments
Updated Model Features
Over the past year the Agency has developed the following improvements to its Level 2 avian acute risk model:
Selection of typified bird types based on nesting and feeding behavior
Incorporation of an avian bimodal feeding pattern with a behavioral fidelity factor which allows for consideration of individual animal behavior that deviates from the population mean
Dynamic model of pesticide runoff, partitioning, and degradation in on-field storm water-derived wildlife drinking water sources
Inhalation exposure from pesticide spray and within crop canopy volatilized pesticide
Dermal exposure from pesticide spray and contact with dislodgeable foliar residues
Typified Bird Species
Species grouped by:
- Nesting Habitat
- Foraging Habitat
- Type of food Consumed
- Adjust food habits by crop (row crop, field/orchard, turf/pasture)
| Resident insectivore | Buffer Insectivore |
| Resident herbivore | Buffer herbivore |
| Resident granivore | Buffer granivore |
Bimodal Feeding Pattern
The Level 2 model integrates a bimodal daily feeding pattern model with a two-state, first-order Markov chain model of on-field/off-field behaviors. This integration permits improved simulation of individual behaviors and exposures. Key elements include:
the use of existing information on frequency of observation information for agricultural fields
partitioning of daily ingestion rates to account for bimodal daily feeding patterns
allows for user-specified starting and ending times based on seasonal influences
estimation of the Markov chain transitional probabilities
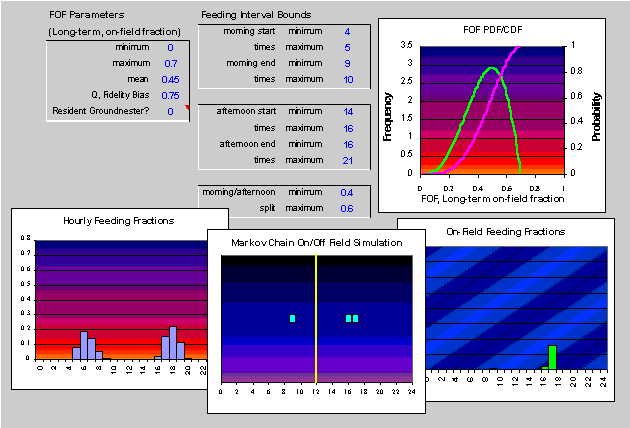
Integrated Level 2 Model
Behavioral Fidelity
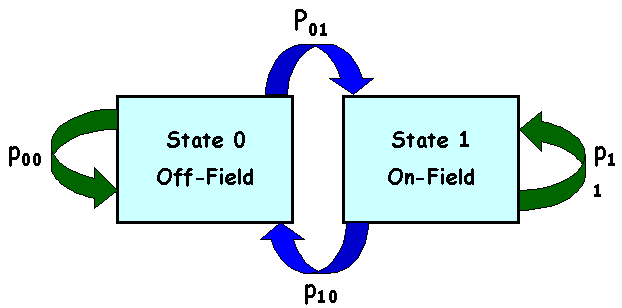
Transitional probabilities for the Level 2 two-state, first-order model of avian behavioral fidelity
Field-Scale Puddle Model
Equilibrium based,mass accounting model of the runoff, infiltration, and dissipation of pesticide in an on-field puddle. Used as the basis for wildlife drinking water exposure. Allows for a temporally limited puddle, based on infiltration and evaporation.
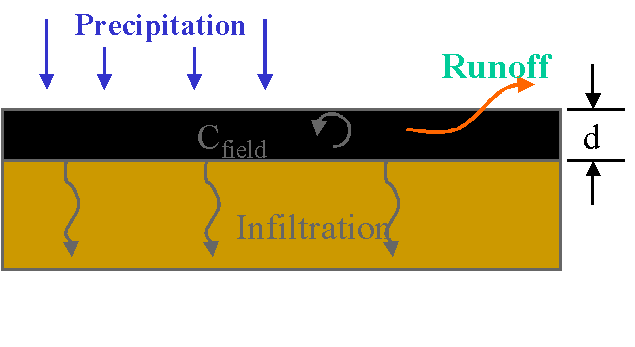
Pesticide runoff:
Soil infiltration rate is dependant upon soil type.
Precipitation events are linked to site specific meteorological data
Runoff based on NRCS curve number method
Depth of runoff interaction zone (d) is based on literature
Interception of Runoff
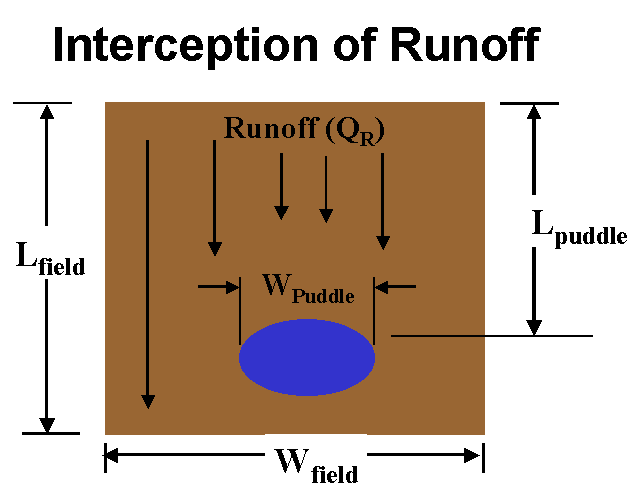
Puddle interception of runoff:
Puddle size and position on field are randomly varied
Puddle Hydrology/Pesticide Concentration
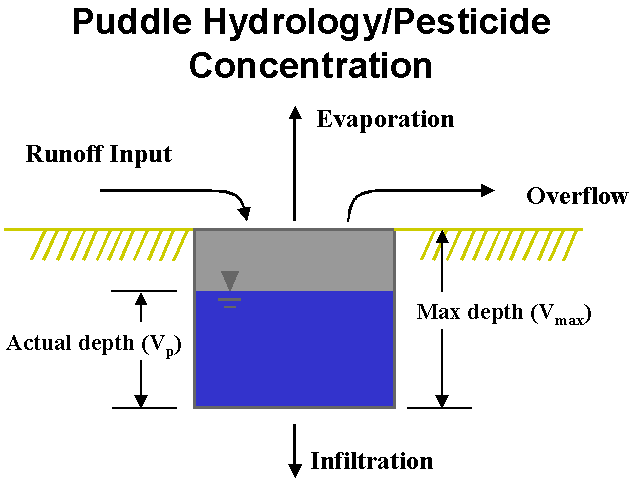
Puddle hydrology:
Puddle volume is an important factor in determining the pesticide mass retained after a precipitation event
Modeling the Inhalation Route
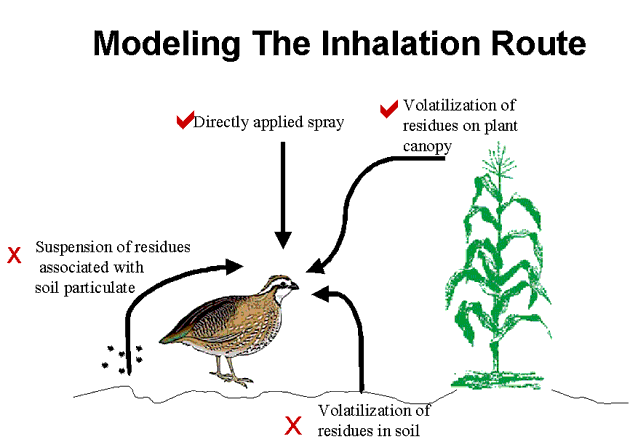
Modeling the Inhalation Route
Inhalation of Directly Applied Spray
Inhalation dose = [(mass/area)(1/release height)(fraction respired)(inhalation volume)] / body weight
mass/area: application rate from label
release height: default spray drift assumption (ground or aerial)
fraction respired: volumetric droplet spectrum segregated by upper size limit of respired particles for birds (ca. 7 um)
inhalation volume: (inhalation rate)(exposure duration)
Calculating Air Concentration
Direct spray as per screening model
Mass conserved model for vapor phase
Assumes application to plant canopy
Assumes a closed box of dimensions limited to height of canopy
Relies on EFED-accepted equilibrium approach for other media
C air = (Mass pesticide mg/Ha) / (V air + (Mass plant*(B vol / Density plant)))
V air : Air volume based on crop canopy height
Mass plant : Mass of crop in a hectare of treated field
Density plant : Density of fresh crop material
B vol : Plant/air biotransfer factor (USEPA HWIR)
log B vol = (1.065(K ow) - log(HL / (UGC*K°)) -1.654
Modeling the Dermal Route
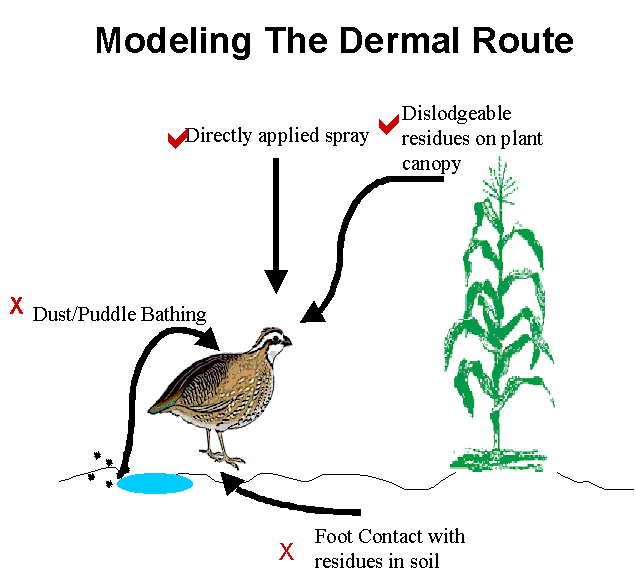
Modeling the Dermal Route
Directly Applied Spray Dermal Exposure
Application of pesticide per unit area from the label
Surface area of a bird from USEPA 1993 and bodyweight
Dermal dose = [(application rate)(surface area)(fraction absorbed)] / body weight
Fraction absorbed would be assumed to be 100% in screen, could be better defined for next LOR
Dermal Contact with Foliar Residues
Screen does not distinguish residues from soil and plant sources (higher levels should segregate these)
Based on HED approach for workers
Bird is assumed to contact a set surface area of foliage/soil over a given exposure period
Residues are estimated based on application rate of pesticide (this is likely a maximum)
Example Model Outputs
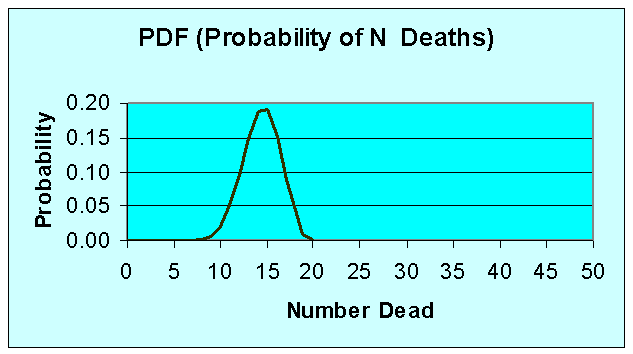
PDF (Probability of N Deaths)
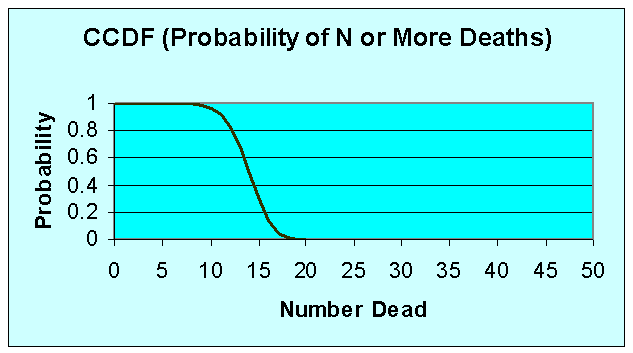
CCDF (Probability of N or More Deaths)
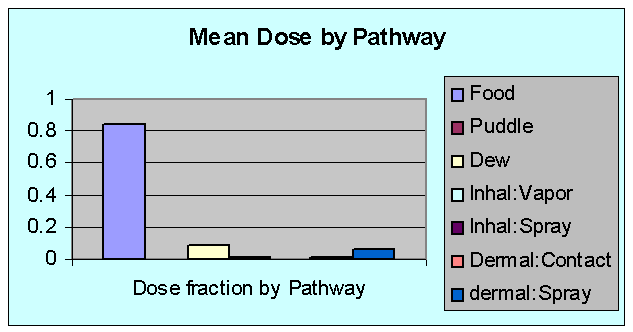
Mean Dose by Pathway
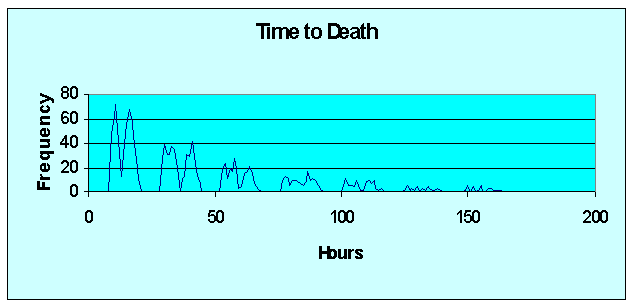
Time to Death
![[logo] US EPA](../gif/logo_epaseal.gif)