Jump to main content.


Progress Report of the Ecological Committee on FIFRA Risk Assessment Methods:
VII. Terrestrial Risk Assessment; Figures

On this Page


Graphic depiction of probabilistic model of risk of death to birds

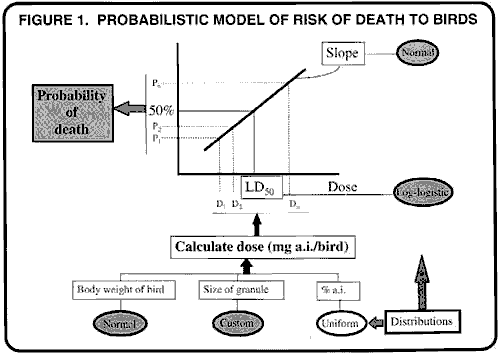
Figure 1. Probabilistic Model of Risk of Death to Birds

Top of page


four graphs: frequency vs. log of species sensitivity; frequency vs. probit slope of LD50; frequency vs. species weight in grams; frequency vs. granule weight in milligrams

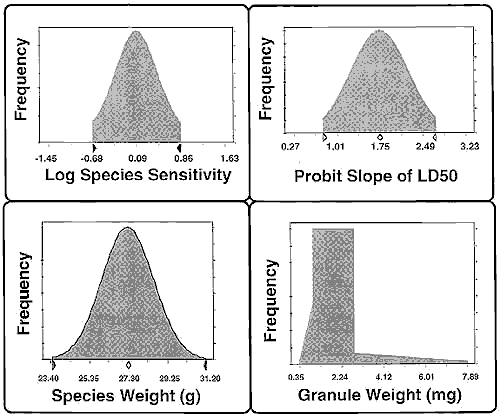
Figure 2. Distributions Used in Probabilistic Model

Top of page


graph of forecasted probablility of death; percent of population vs. likelihood of death

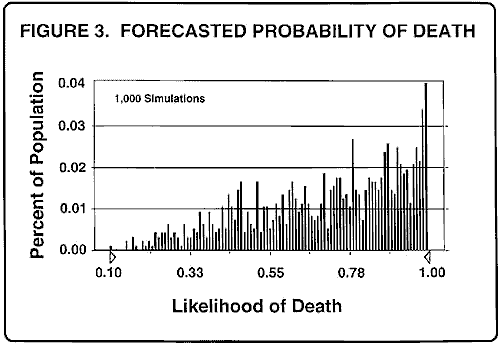
Figure 3. Forecasted Probability of Death

Top of page


bar charts representing sensitivity analysis; bars of correlation values for each of four parameters: species sensitivity, granule weight, probit slope of LD50, species weight.

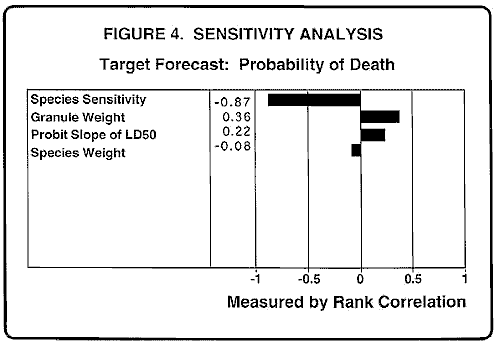
Figure 4. Sensitivity Analysis

Top of page


graph of multispecies risk assessment; y-axis of percent of species tested; two parameters for x-axis: number of granules per LD50 per bird; estimated number of consumed granules per day

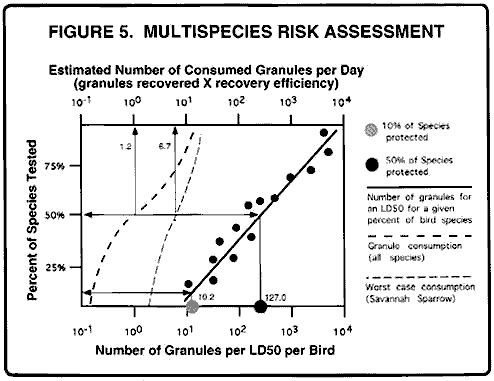
Figure 5. Multispecies Risk Assessment

Top of page


Publications | Glossary | A-Z Index | Jobs


Local Navigation


Jump to main content.