Evolution of OPP's Terrestrial Investigation Model
Software and Programming to Meet Technical/Regulatory Challenges
Edward Odenkirchen, Ph.D.
Environmental Fate and Effects Division
Office of Pesticide Programs
USEPA
On this Page
- Background : Terrestrial Investigation Model (TIM 1.0)
- TIM 1.0: Why Excel and Crystal Ball?
- 2001 SAP Recommendations
- The complex was to get even more complex . . .
- Changes for New Model
- Model Changes and Their Effects on TIM 1.0 Environment
- Selecting a New Programming Environment: Criteria
- Approach Taken for TIM 2.0
- TIM 2.0
- The TIM 2.0 User Interface
- Application Method and Rate and Site Properties
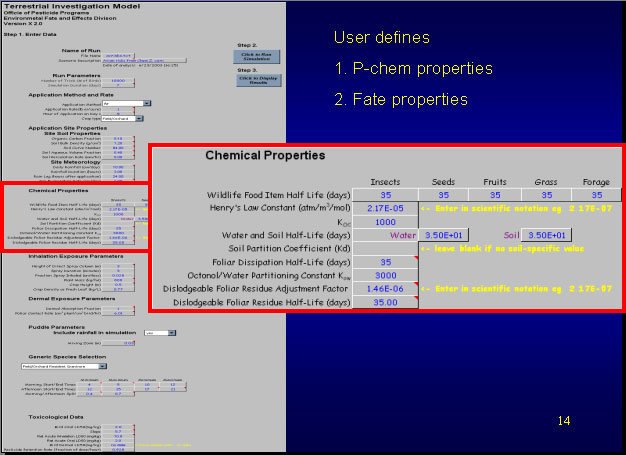
- Chemical Properties
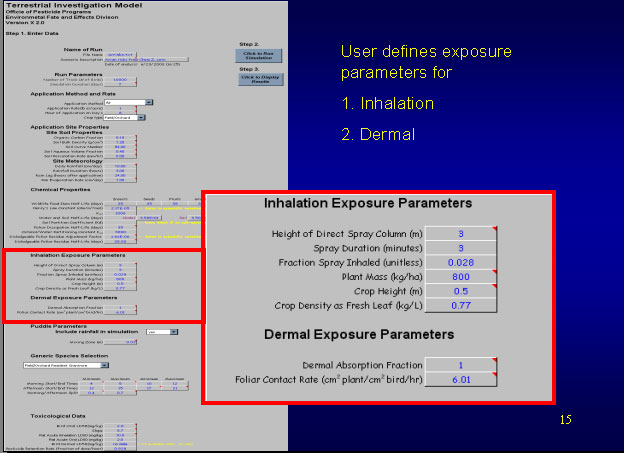
- Exposure Parameters
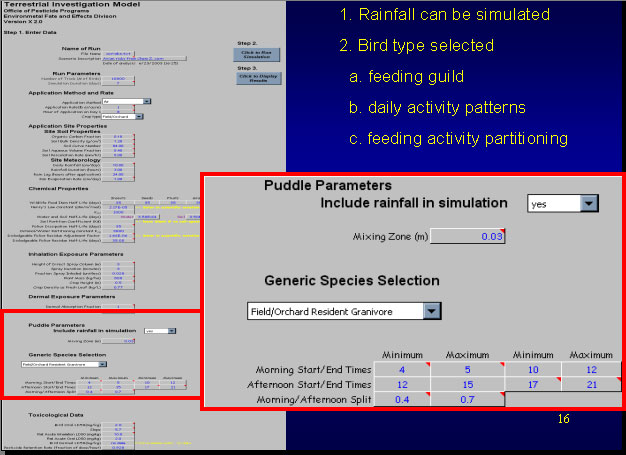
- Puddle Parameters and Generic Species Selection
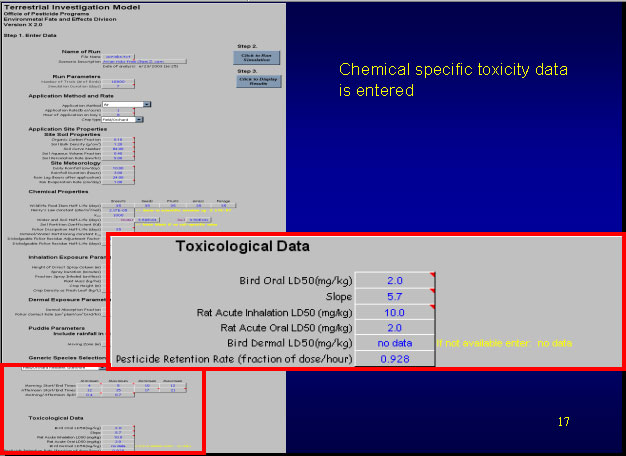
- Toxicological Data
- Run Model and Display Results
- Excel Interface Options
- Excel Input and C-core Program Flexibility
- Excel Input and C-core Program Limitations
- Next Steps
- Web Site
- EPA Implementation Team
Background : Terrestrial Investigation Model (TIM 1.0)
Designed to account for:
single applications of pesticides
dietary and drinking water exposure
Developed using Excel Spreadsheets and Crystal Ball
Presented to Agency's Scientific Advisory Panel (SAP) in 2001
TIM 1.0: Why Excel and Crystal Ball?
Model authors experienced with Excel
Relative ease tracking components of model
Trouble shooting math is straightforward
Sub-routines can be developed independently and then easily incorporated into overall model
Easy to develop user interface
Familiarity with Crystal Ball's incorporation of Excel
Reasonable model run time (9-10 min @ 400 mHz)
2001 SAP Recommendations
Improve method for estimating surface water concentrations as drinking water source
Address inhalation and dermal exposure
Alterations in daily wildlife activity algorithm
More frequent time steps per modeled day of activity
The complex was to get even more complex . . .
The complex was to get even more complex . . .
Changes for New Model
| Model Component | TIM 1.0 | TIM 2.0 |
|---|---|---|
| Drinking water | Mean daily value from PRZM and variance from field data on puddles | Model of field puddles Monte Carlo |
| Inhalation | None | Vapor and droplet phase; potency factor |
| Dermal | None | Direct deposition and incidental contact with foliage; potency factor |
| Use of treatment area over daily activity | Set once / individual; even distribution of feeding activity | Hourly Time Steps with Monte Carlo sampling; bimodal distribution of activity |
| Repetition of daily activity pattern | Constant | Markov chain |
| Tolerance level | Probability of death interpolated for individual modeled dose | Tolerance set for individuals, time to death (if any) tracked |
Model Changes and Their Effects on TIM 1.0 Environment
Modeling surface water: complex differential equations, numerical solutions
Number of variables doubled from TIM 1.0
New activity patterns: additional Monte Carlo sampling routines
Increase in time steps increased overall calculations required by 12x
New routes of exposure: modeling additional environmental media (air, dislodgeable residues)
BOTTOM LINE: Too many calculations for timely runs in Excel/Crystal Ball environment (run times in HOURS not minutes)
Selecting a New Programming Environment: Criteria
Easy assembly of sub-routines
Availability of numerical recipes for solving complex mathematics
Fast run time
Graphical user interface can be easily updated as new model requirements arise
Automated reporting
Approach Taken for TIM 2.0
Initial development of new subroutines in either Excel or Mathematica
known to key model developers
quick development time
illustrates sub-routines to assist programming of core program
Core program in C
known to key team members
basics are easy to pick up
numerical recipes available from commercial vendors for complex math and statistics
once compiled, model is standardized
Graphical user interface based on Excel
familiarity to developers and expected users
easy to develop input sheets and automate reporting routines with visual basic
flexibility and ease of updating interface
TIM 2.0
TIM 2.0
The TIM 2.0 User Interface
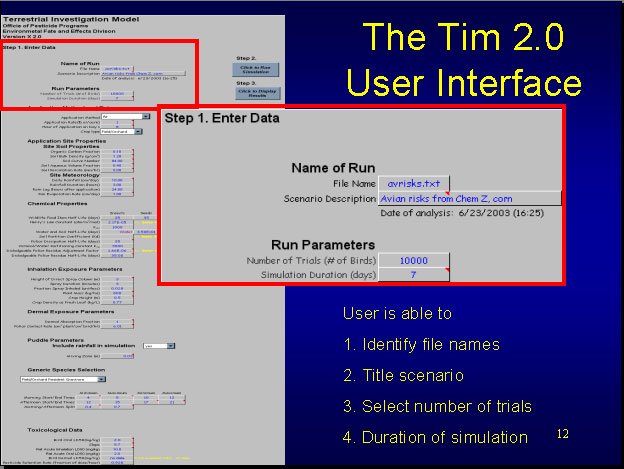
The TIM 2.0 User Interface
Application Method and Rate and Site Properties
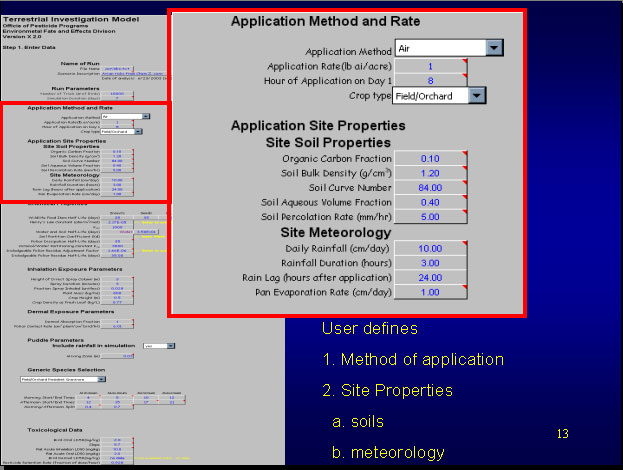
Application Method and Rate and Site Properties
Chemical Properties
Chemical Properties
Exposure Parameters
Exposure Parameters
Puddle Parameters and Generic Species Selection
Puddle Parameters and Generic Species Selection
Toxicological Data
Toxicological Data
Run Model and Display Results
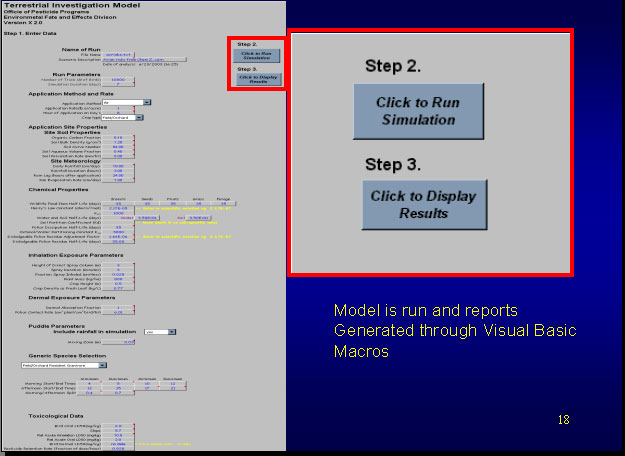
Run Model and Display Results
Excel Interface Options
Comments can be attached to data entry boxes to allow for user instructions
Drop-down menus can serve as standardization tools to limit user-defined options (note also a custom input option where user can fully customize model scenario)
Data Entry Quality Control can be achieved with simple logic routines in entry forms
Excel Input and C-core Program Flexibility
Speed (run time less than 20 seconds)
User Interface can be updated quickly to allow for more parameters
Inputs can be logically grouped without affecting core program
New computational routines can be appended to core program without affecting user interface.
Excel Input and C-core Program Limitations
Program is not a single computer file
Updates to program will require careful documentation and packaging (file structure) to ensure compatible input and core program files are run.
Next Steps
Complete Level 2 model development
Develop model documentation and training materials
Obtain peer review comments (SAP)
Beta test
Implement
Modify code to allow multiple application scenarios
Improve vapor phase modeling (kinetics based)
Web Site
https://www.epa.gov/pesticides/ecosystem/index.htm
EPA Implementation Team
Chair
Ingrid Sunzenauer, M.S.
Aquatic Team
Donna Randall, M.S. (Lead)
Terrestrial Team
Ed Fite, M.S. (Lead)
Ed Odenkirchen, Ph.D.
Additional Supporting Team Members
Tim Barry, Sc.D. (EPA Office of the Administrator)
Dirk Young, Ph.D.
Douglas Urban, M.S.
Stephanie Irene, Ph.D.
Former Team Members
Kathryn Gallagher, Ph.D. (Former Lead, Aquatics)